Fig. 2.
Download original image
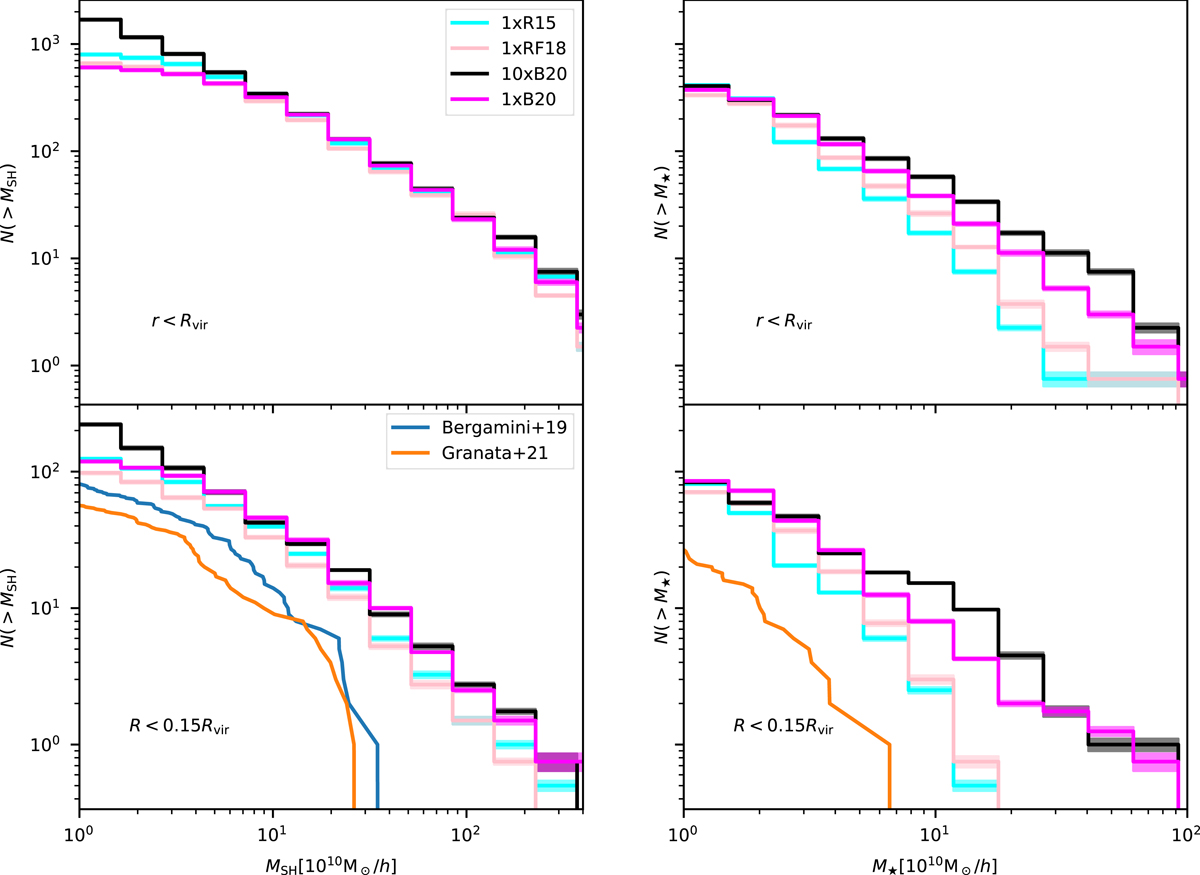
Average cumulative number of satellite sub-structures with total mass larger than MSH and lower than 1013 h−1 M⊙ (left column) and for stellar masses larger than M⋆, computed within an aperture of 30 physical kpc. We show data for the four 1 × R15 (cyan), 1 × RF18 (pink), 10 × B20 (black), and 1 × B20 (magenta) simulations in common between the four suites (i.e., D3, D6, D18, and D25 presented in Table 2). For each simulation we average data over three orthogonal projections. Shaded area represents standard deviation between different setups. Upper panels consider SHs within the virial radius and lower panels consider SHs with projected cluster-centric distance R < 0.15Rvir. Left panels show cumulative number of total SH mass MSH, while right panels show cumulative mass of galaxy stellar mass associated with each SH. Observations are from the central region (R < 0.15Rvir) of cluster AS1063 presented in Bergamini et al. (2019) and Granata et al. (2022). Both simulations and observations have an average redshift of z ≈ 0.4.
Current usage metrics show cumulative count of Article Views (full-text article views including HTML views, PDF and ePub downloads, according to the available data) and Abstracts Views on Vision4Press platform.
Data correspond to usage on the plateform after 2015. The current usage metrics is available 48-96 hours after online publication and is updated daily on week days.
Initial download of the metrics may take a while.