Fig. 1.
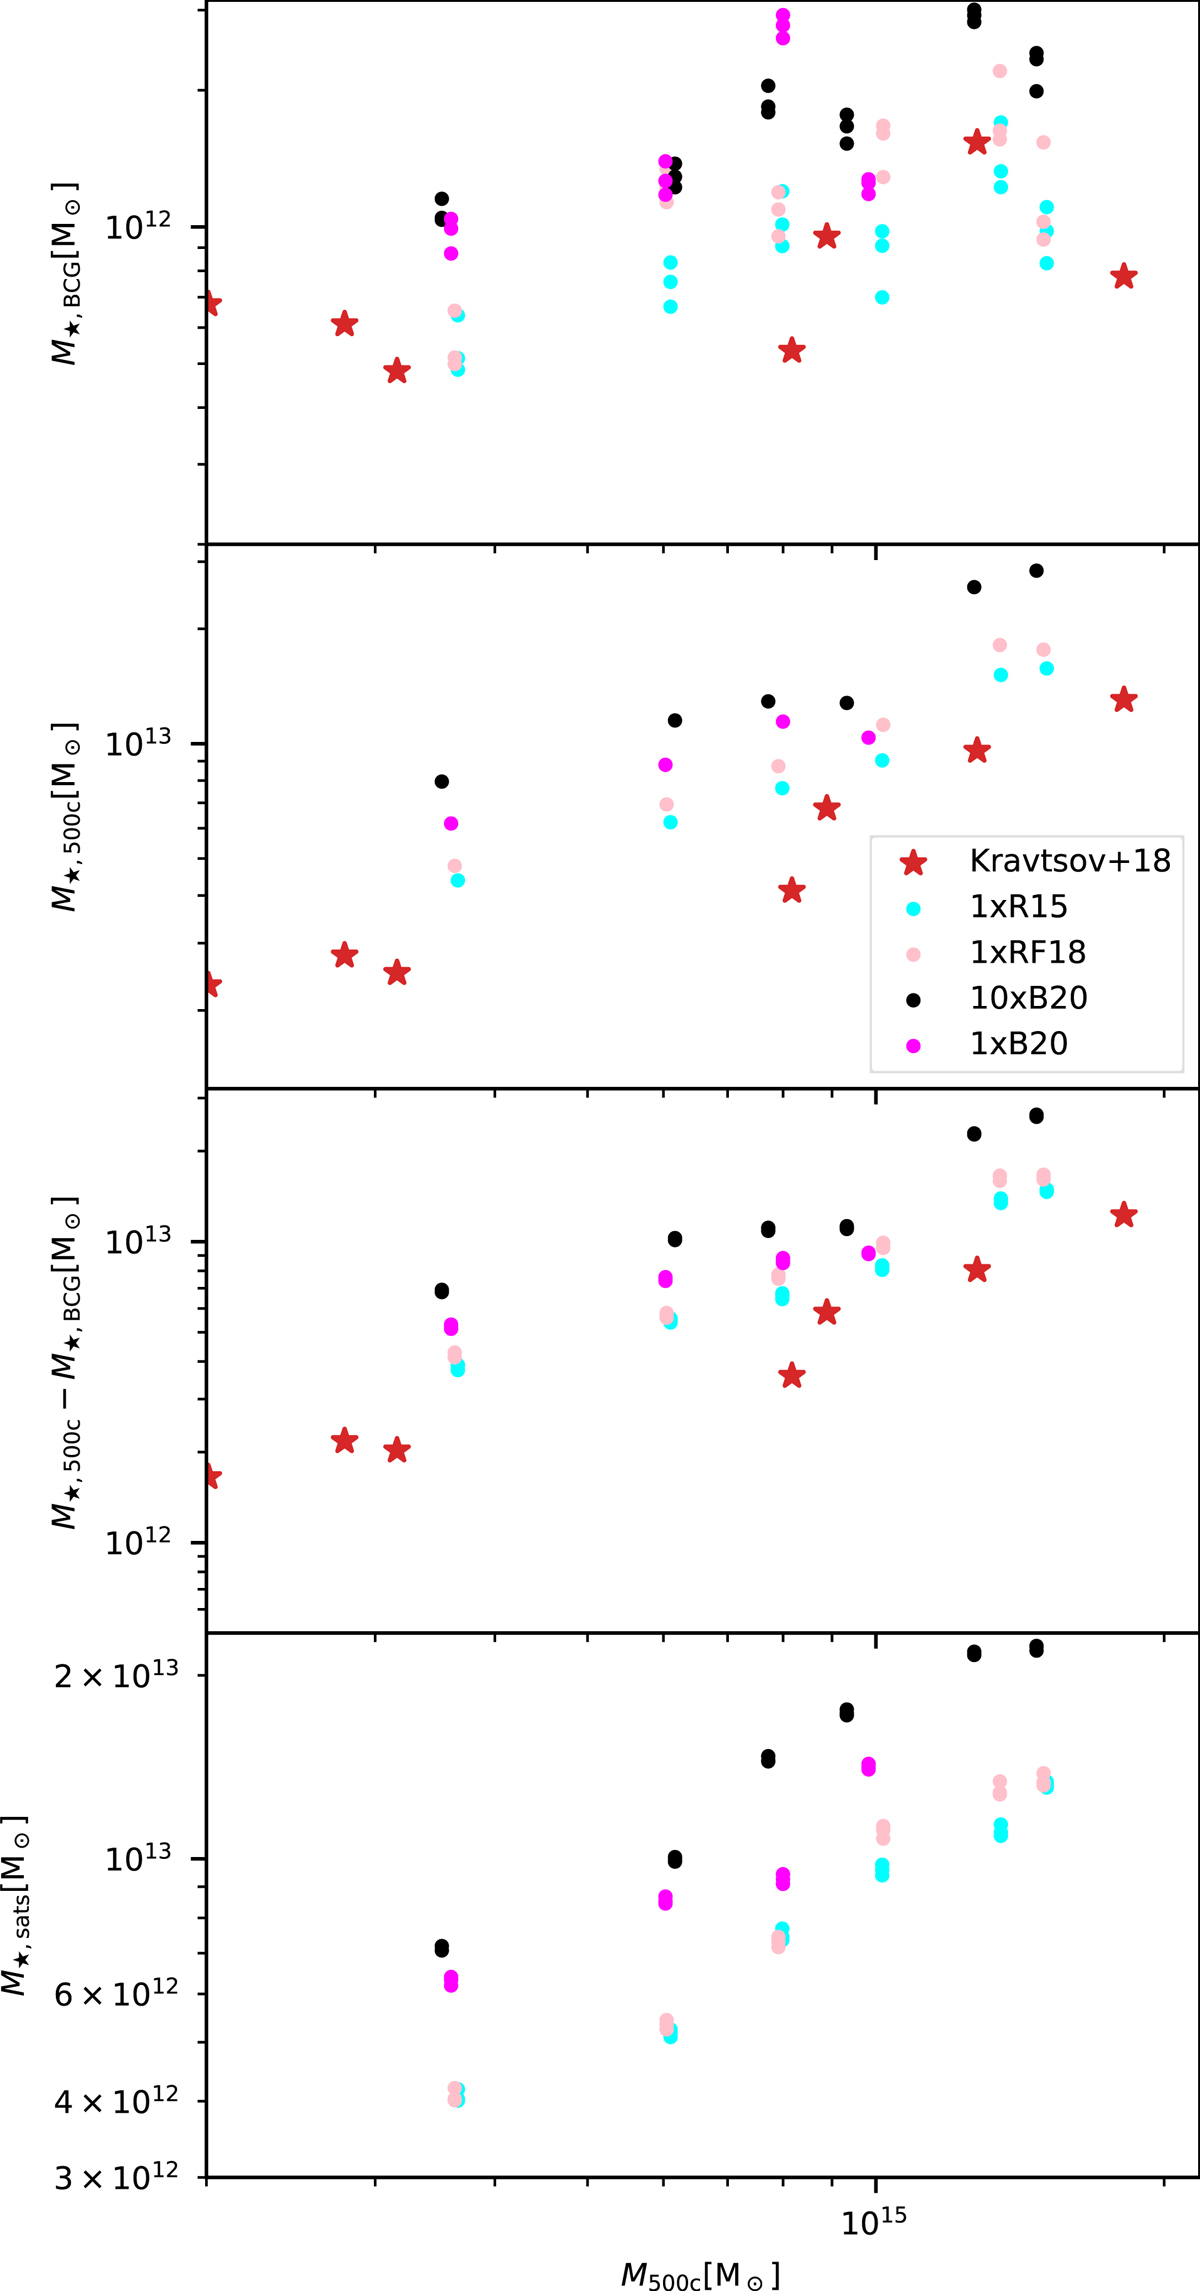
Download original image
Comparison of BCG mass (first panel), stellar mass (second panel), and satellite (i.e., stellar mass minus BCG mass, third panel) values and the stellar mass sum of all well-resolved SHs within Rvir (fourth panel) within R500c for our four suites (circles coloured as in the label) and with the observational data from Kravtsov et al. (2018) (red stars). BCG masses are computed within a projected aperture of 50 physical kpc, and for each region we present masses from three orthogonal projections. From left to right, data points correspond to the main haloes of the following regions: D25, D3, D6, D18, D10, and D1 presented in Table 2.
Current usage metrics show cumulative count of Article Views (full-text article views including HTML views, PDF and ePub downloads, according to the available data) and Abstracts Views on Vision4Press platform.
Data correspond to usage on the plateform after 2015. The current usage metrics is available 48-96 hours after online publication and is updated daily on week days.
Initial download of the metrics may take a while.