Fig. 9
Download original image
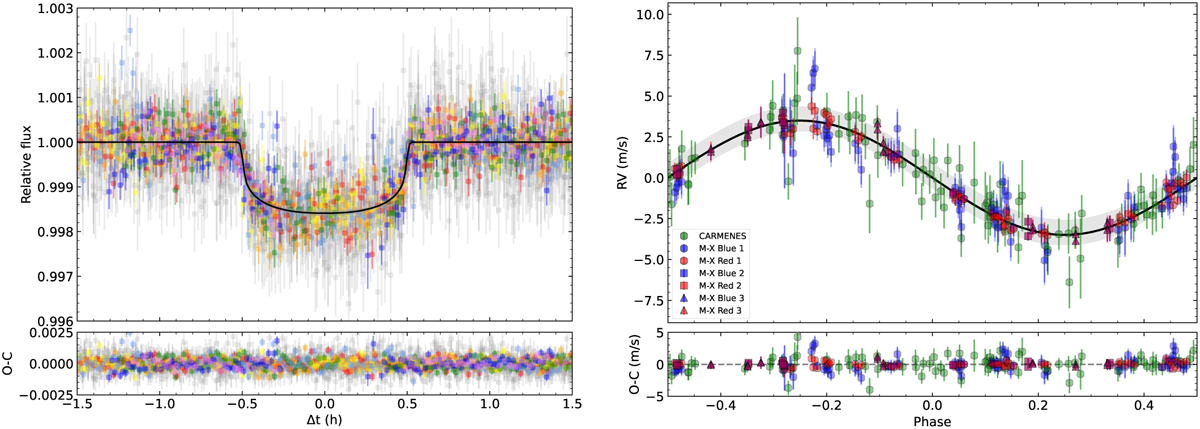
Phase-folded transit and RV data and lpl+GP model fits. Left: light-curve model fit (black line) and CHEOPS+TESS data with the same symbol colours as in Fig. 1 (grey: TESS; rainbow colours: CHEOPS). Right: RV-curve model fit (black line with ±1σ uncertainty marked with a grey shaded area) and CARMENES+MAROON-X data with the same colours as in Fig. 2. Error bars include original RV uncertainties (opaque) and jitter added in quadrature (semi-transparent).
Current usage metrics show cumulative count of Article Views (full-text article views including HTML views, PDF and ePub downloads, according to the available data) and Abstracts Views on Vision4Press platform.
Data correspond to usage on the plateform after 2015. The current usage metrics is available 48-96 hours after online publication and is updated daily on week days.
Initial download of the metrics may take a while.