Fig. 8
Download original image
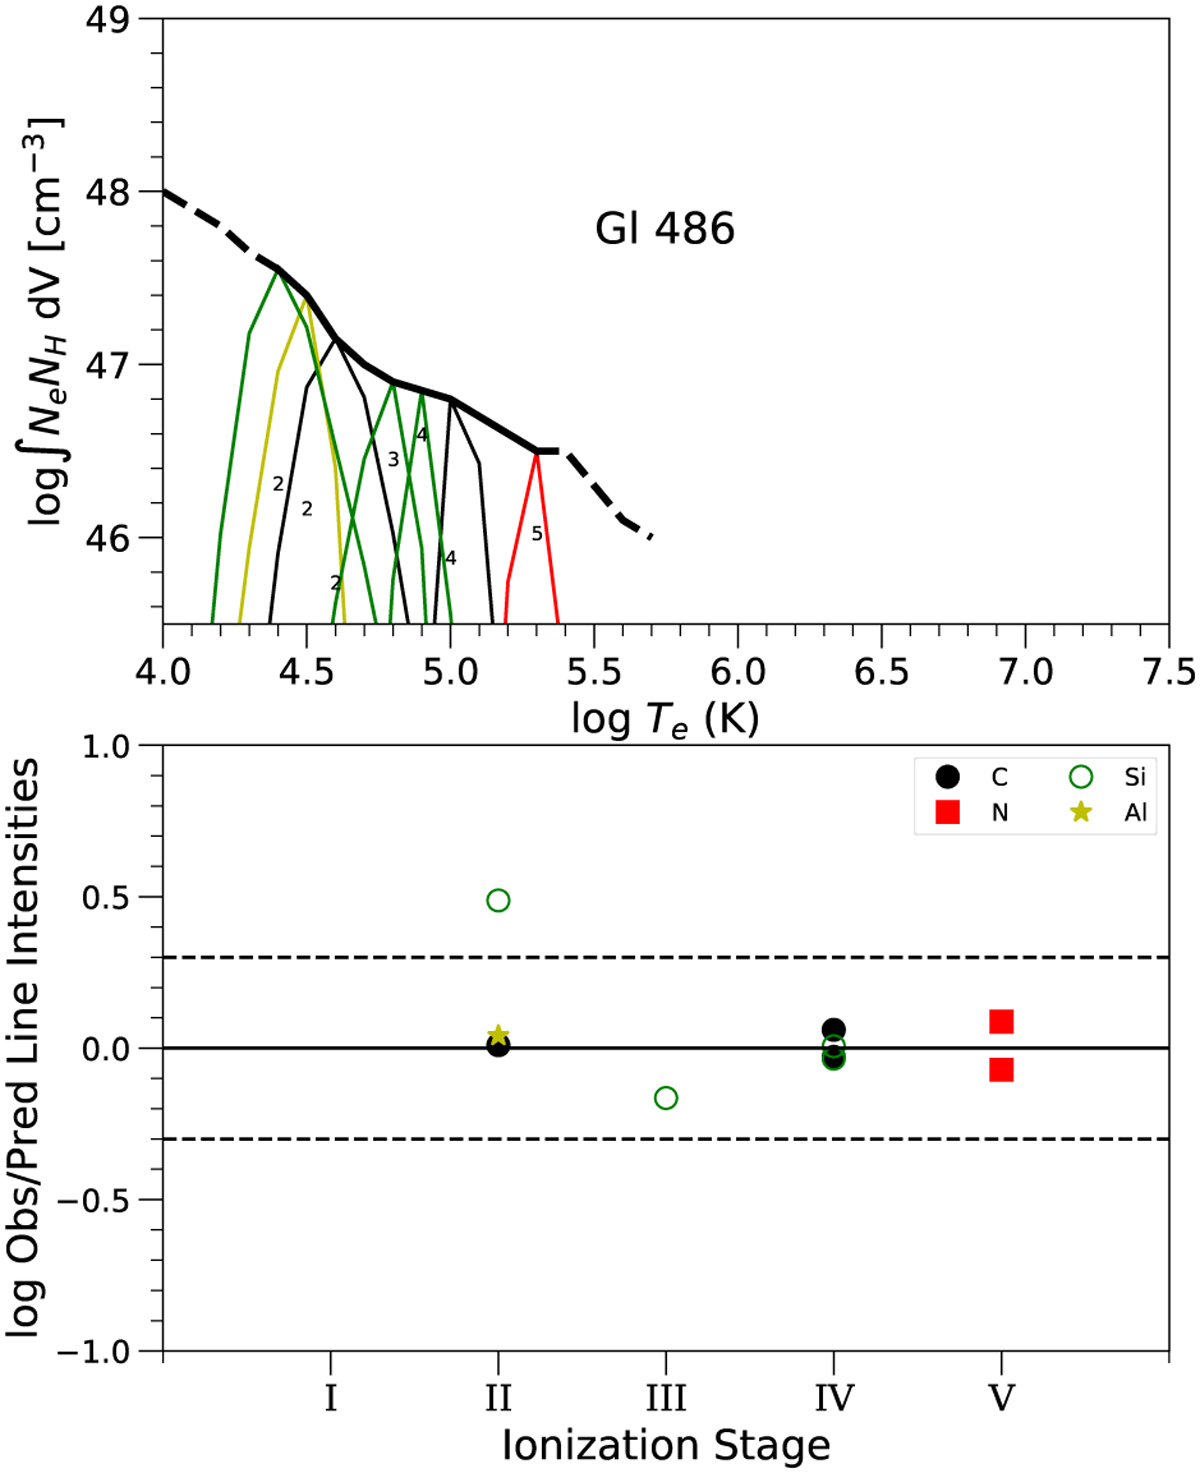
Stellar coronal emission of Gl 486 from ultraviolet spectroscopy. Top: emission measure distribution from Hubble/STIS data. Thin, coloured lines represent the relative contribution function for each ion (the emissivity function multiplied by the emission measure distribution at each point). Numbers within the graph indicate the ionisation stages of the species. Bottom: observed-to-predicted line flux ratios for the ion stages in the upper figure. The dashed lines denote a factor of two.
Current usage metrics show cumulative count of Article Views (full-text article views including HTML views, PDF and ePub downloads, according to the available data) and Abstracts Views on Vision4Press platform.
Data correspond to usage on the plateform after 2015. The current usage metrics is available 48-96 hours after online publication and is updated daily on week days.
Initial download of the metrics may take a while.