Fig. 4
Download original image
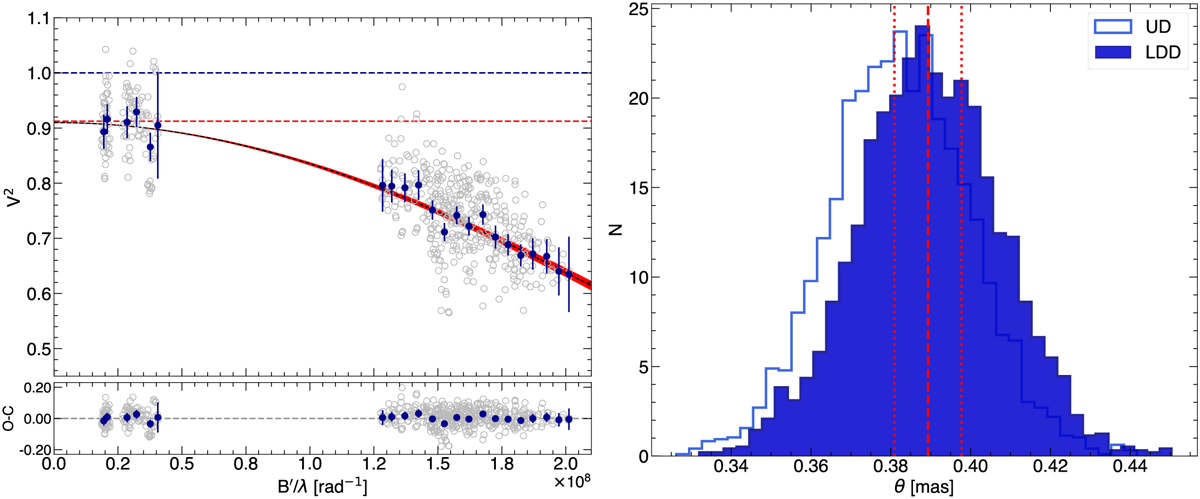
Interferometric determination of the Gl 486 radius with the CHARA Array. Left: MIRC-X squared visibility as a function of spatial frequency (B′/λ, baseline over wavelength). Open grey circles indicate actual measurements, dark blue filled circles with error bars are binned data with standard deviation, and dashed curve and red shadow are our angular diameter fit and its uncertainty. The horizontal dashed lines indicate the visibility at unity (blue) and at unity minus the correction ![]() (red). Right: histograms of uniform (open, light blue) and limb-darkened disc (filled, dark blue) angular diameters. Red vertical lines indicate 15.8% (dotted), 50.0% (median, dashed), and 84.5% (dotted) confidence intervals for the limb-darkened disc angular diameter.
(red). Right: histograms of uniform (open, light blue) and limb-darkened disc (filled, dark blue) angular diameters. Red vertical lines indicate 15.8% (dotted), 50.0% (median, dashed), and 84.5% (dotted) confidence intervals for the limb-darkened disc angular diameter.
Current usage metrics show cumulative count of Article Views (full-text article views including HTML views, PDF and ePub downloads, according to the available data) and Abstracts Views on Vision4Press platform.
Data correspond to usage on the plateform after 2015. The current usage metrics is available 48-96 hours after online publication and is updated daily on week days.
Initial download of the metrics may take a while.