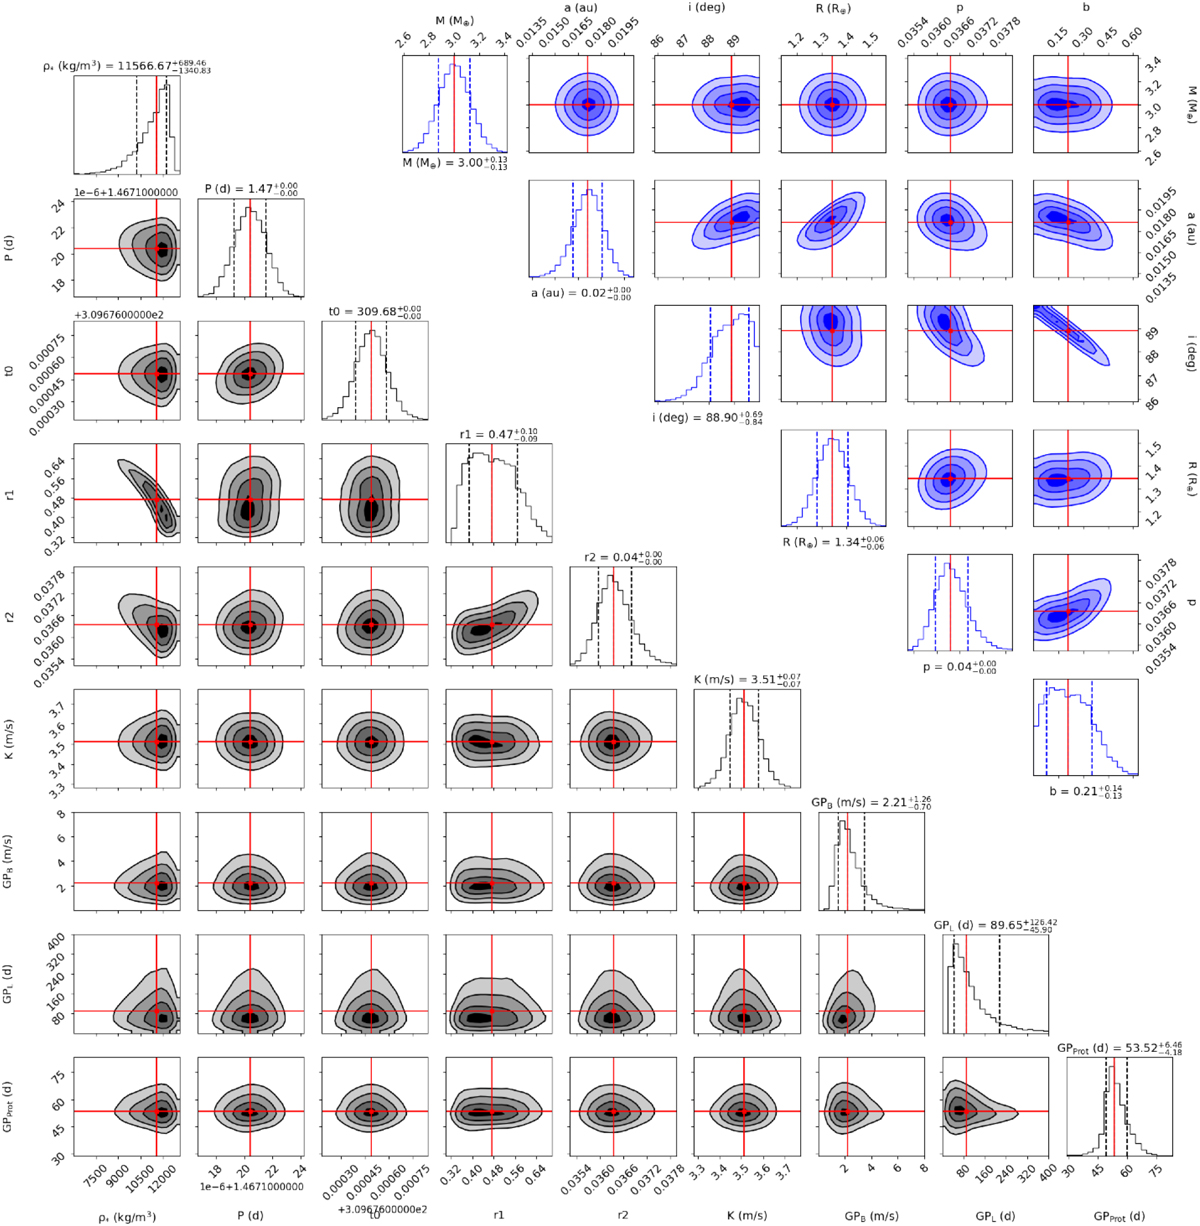
Fig. A.3
Download original image
Nested samples distribution of fitted (black) and derived (blue) parameters of Gl 486 b with CARMENES and MAROON-X RV data and CHEOPS and TESS light curves. The position of the median from the posterior is marked with red grid lines. The contours on the 2D panels represent the 1σ, 2σ, and 3σ confidence levels of the overall posterior samples. The top (black) and bottom (blue) panels of every column represent the 1D histogram distribution of each parameter.
Current usage metrics show cumulative count of Article Views (full-text article views including HTML views, PDF and ePub downloads, according to the available data) and Abstracts Views on Vision4Press platform.
Data correspond to usage on the plateform after 2015. The current usage metrics is available 48-96 hours after online publication and is updated daily on week days.
Initial download of the metrics may take a while.