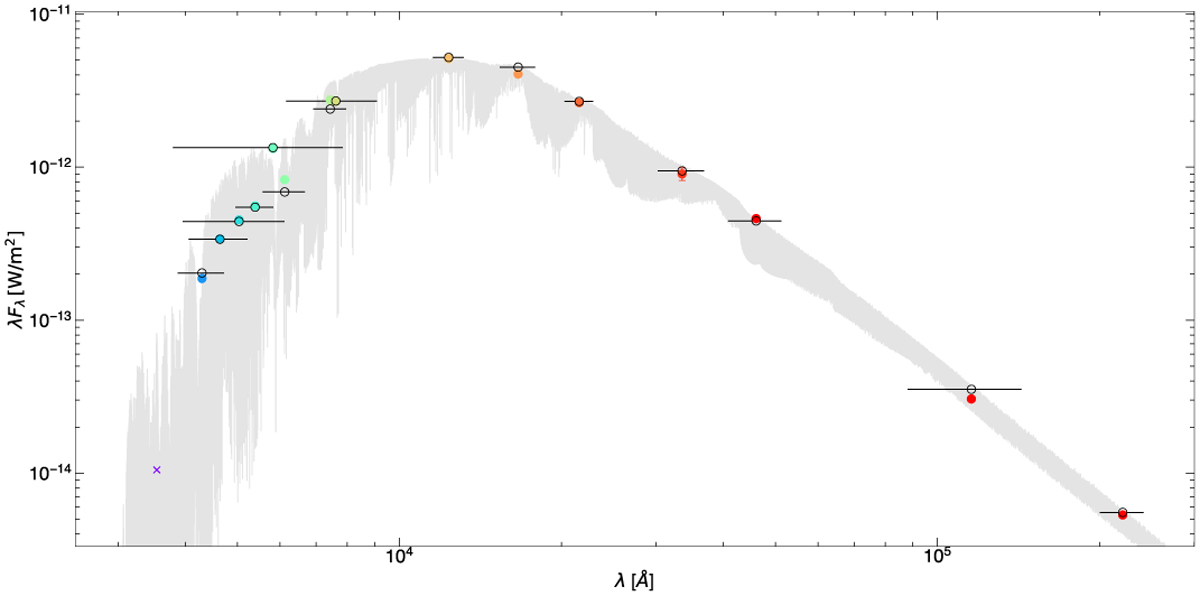
Fig. A.1
Download original image
Spectral energy distribution of Gl 486. The apparent fluxes (coloured filled circles) are imposed on a BT-Settl CIFIST spectrum (grey; Teff = 3200 K and log g = 5.5). The modelled fluxes are depicted as black empty circles. The photometric datum in u’ (purple cross) was not considered for integrating the bolometric luminosity. Horizontal bars represent the effective widths of the bandpasses (equivalent to the horizontal size of a rectangle with height equal to maximum transmission and with the same area that the one covered by the filter transmission curve), while vertical bars (visible only for relatively large values) represent the flux uncertainty derived from the magnitude and parallax errors. See details in Cifuentes et al. (2020).
Current usage metrics show cumulative count of Article Views (full-text article views including HTML views, PDF and ePub downloads, according to the available data) and Abstracts Views on Vision4Press platform.
Data correspond to usage on the plateform after 2015. The current usage metrics is available 48-96 hours after online publication and is updated daily on week days.
Initial download of the metrics may take a while.