Fig. 13
Download original image
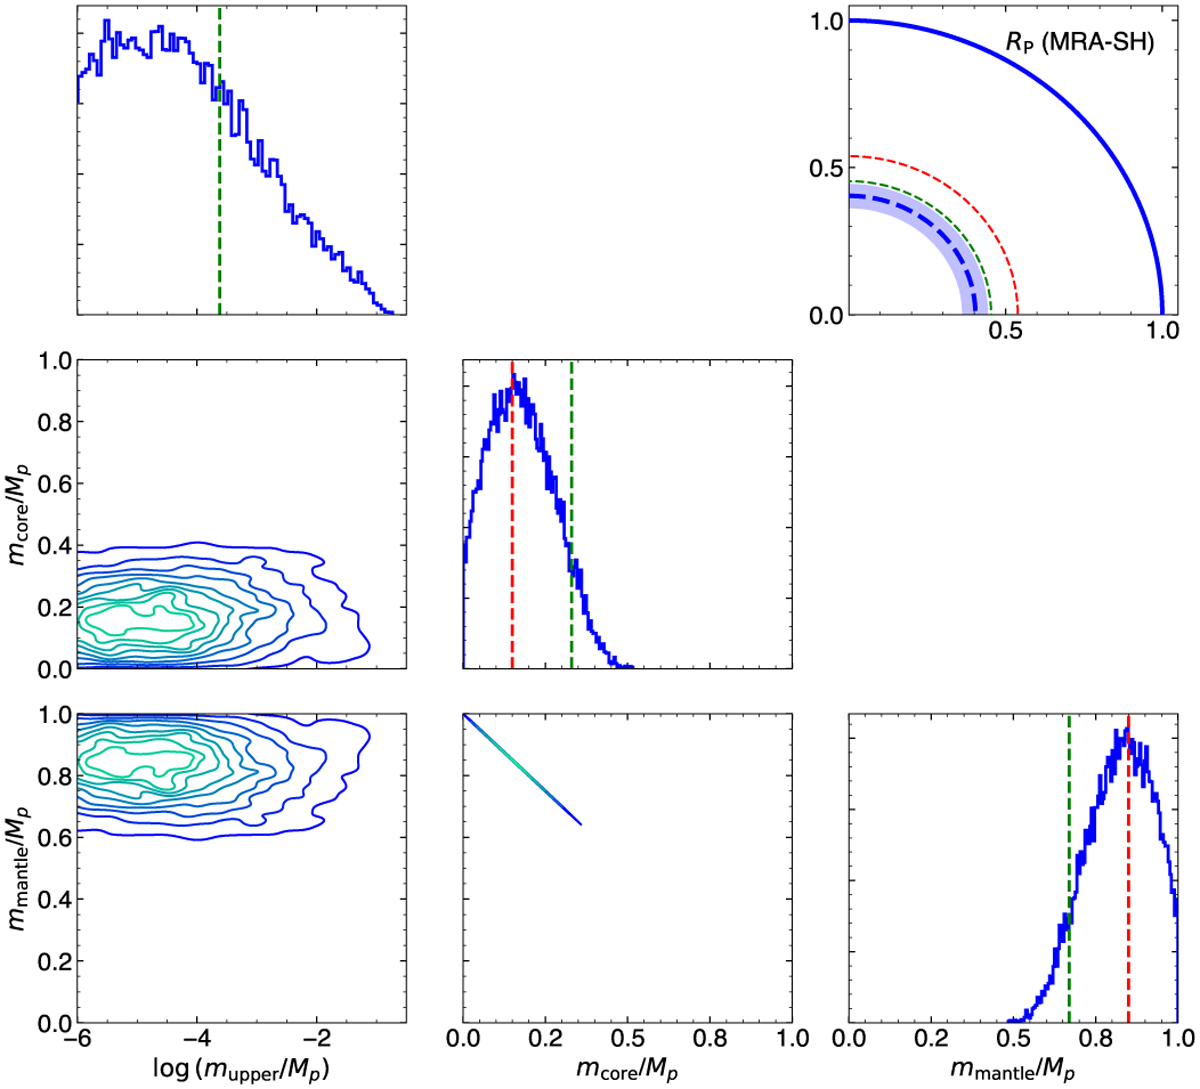
One- and two-dimensional posterior distributions for inferred mass fractions of water log mupper/Mp, mantle mmantle/Mp, and core mcore/Mp for the MRA-SH scenario. The top right panel shows the Rcore/Rp ratio of Gl 486 b (dashed blue with 1σ dashed area) and of the four Solar System telluric planets. Green and red vertical lines denote the Earth and Mars values; comparisons to Mercury and Venus data must be done with caution. Posterior distributions and radii for MR-S and MRA-S scenarios are displayed in Fig. A.2.
Current usage metrics show cumulative count of Article Views (full-text article views including HTML views, PDF and ePub downloads, according to the available data) and Abstracts Views on Vision4Press platform.
Data correspond to usage on the plateform after 2015. The current usage metrics is available 48-96 hours after online publication and is updated daily on week days.
Initial download of the metrics may take a while.