Open Access
Fig. 9.
Download original image
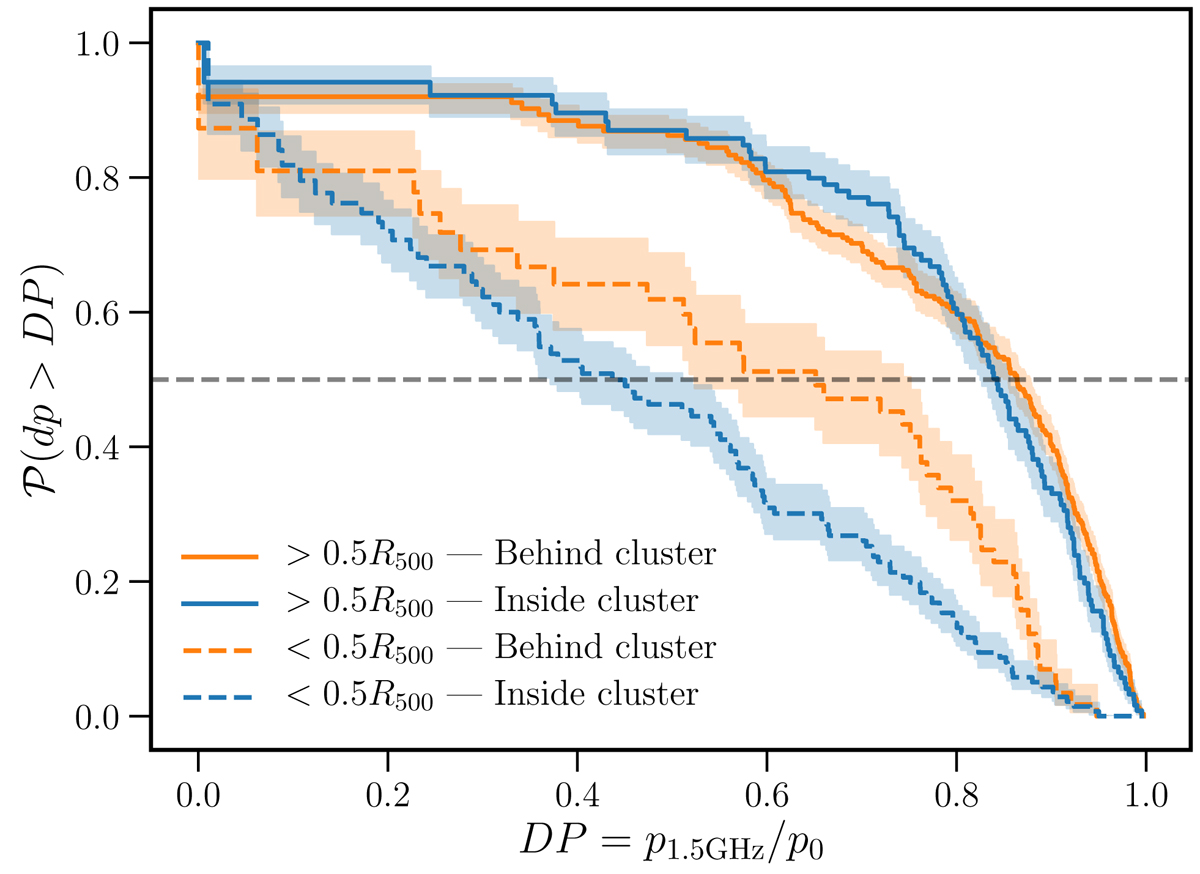
Survival function (i.e. 1-CDF) inferred from the Kaplan-Meier estimator for all sources located at r/R500 > 0.5, and r/R500 < 0.5. Background sources and cluster members are indicated by red and green, respectively. The grey dashed line shows the location of the 50th percentile, indicating the median for both populations.
Current usage metrics show cumulative count of Article Views (full-text article views including HTML views, PDF and ePub downloads, according to the available data) and Abstracts Views on Vision4Press platform.
Data correspond to usage on the plateform after 2015. The current usage metrics is available 48-96 hours after online publication and is updated daily on week days.
Initial download of the metrics may take a while.