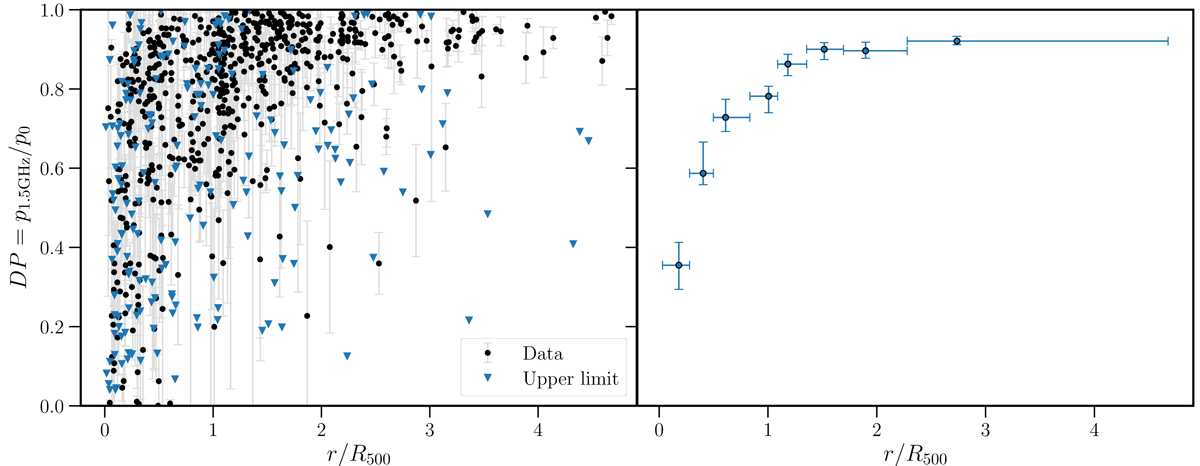
Fig. 7.
Download original image
Depolarisation against normalised projected radius. Left panel: full sample of sources and relevant upper limits. The error bars reflect the 68% confidence interval from the MCMC fitting procedure. Right panel: median of the Kaplan-Meier estimate of the depolarisation ratio survival function in different bins of projected radius to the cluster centre. The bin width is chosen such that each bin contains an equal number of polarised sources and is denoted by the horizontal lines (i.e. 0th and 100th percentile). The points are plotted at the median radius in each bin.
Current usage metrics show cumulative count of Article Views (full-text article views including HTML views, PDF and ePub downloads, according to the available data) and Abstracts Views on Vision4Press platform.
Data correspond to usage on the plateform after 2015. The current usage metrics is available 48-96 hours after online publication and is updated daily on week days.
Initial download of the metrics may take a while.