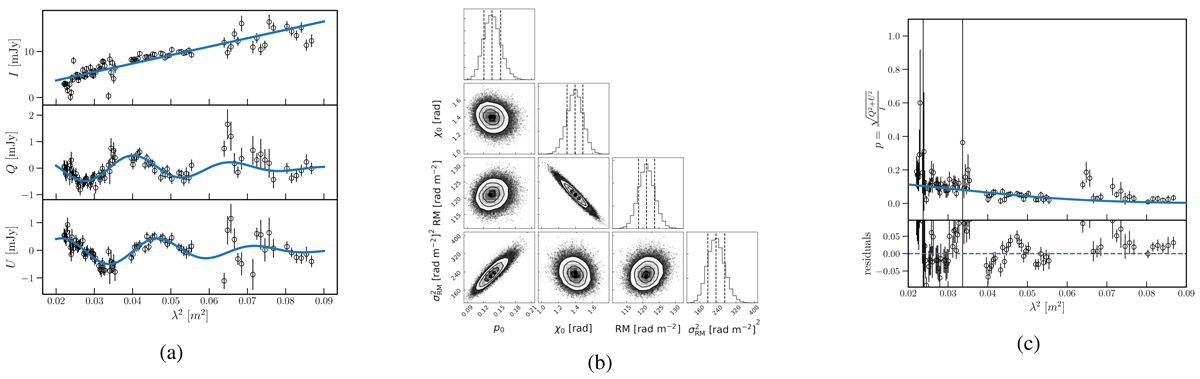
Fig. 4.
Download original image
Results of the MCMC fitting of the external depolarisation model on the Stokes I, Q and U channels to a polarised source with good signal-to-noise ratio. Panel a shows the measured flux densities per channel in black and the best-fit model in blue. Panel b shows the posterior distribution of the model parameters visualised as one and two-dimensional projections in a corner plot. Panel c shows the inferred polarisation fraction from the data and the best-fit model together with the residuals.
Current usage metrics show cumulative count of Article Views (full-text article views including HTML views, PDF and ePub downloads, according to the available data) and Abstracts Views on Vision4Press platform.
Data correspond to usage on the plateform after 2015. The current usage metrics is available 48-96 hours after online publication and is updated daily on week days.
Initial download of the metrics may take a while.