Open Access
Fig. B.1.
Download original image
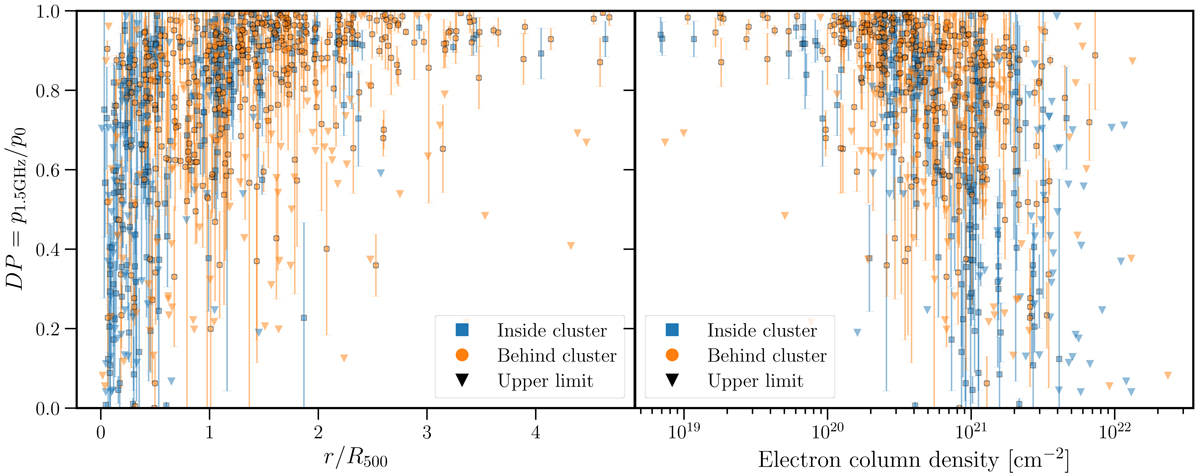
Depolarisation ratio and relevant upper limits for all sources as a function of projected radius and column density. Points are coloured by their position along the line-of-sight with respect to the nearest cluster.
Current usage metrics show cumulative count of Article Views (full-text article views including HTML views, PDF and ePub downloads, according to the available data) and Abstracts Views on Vision4Press platform.
Data correspond to usage on the plateform after 2015. The current usage metrics is available 48-96 hours after online publication and is updated daily on week days.
Initial download of the metrics may take a while.