Open Access
Fig. 23.
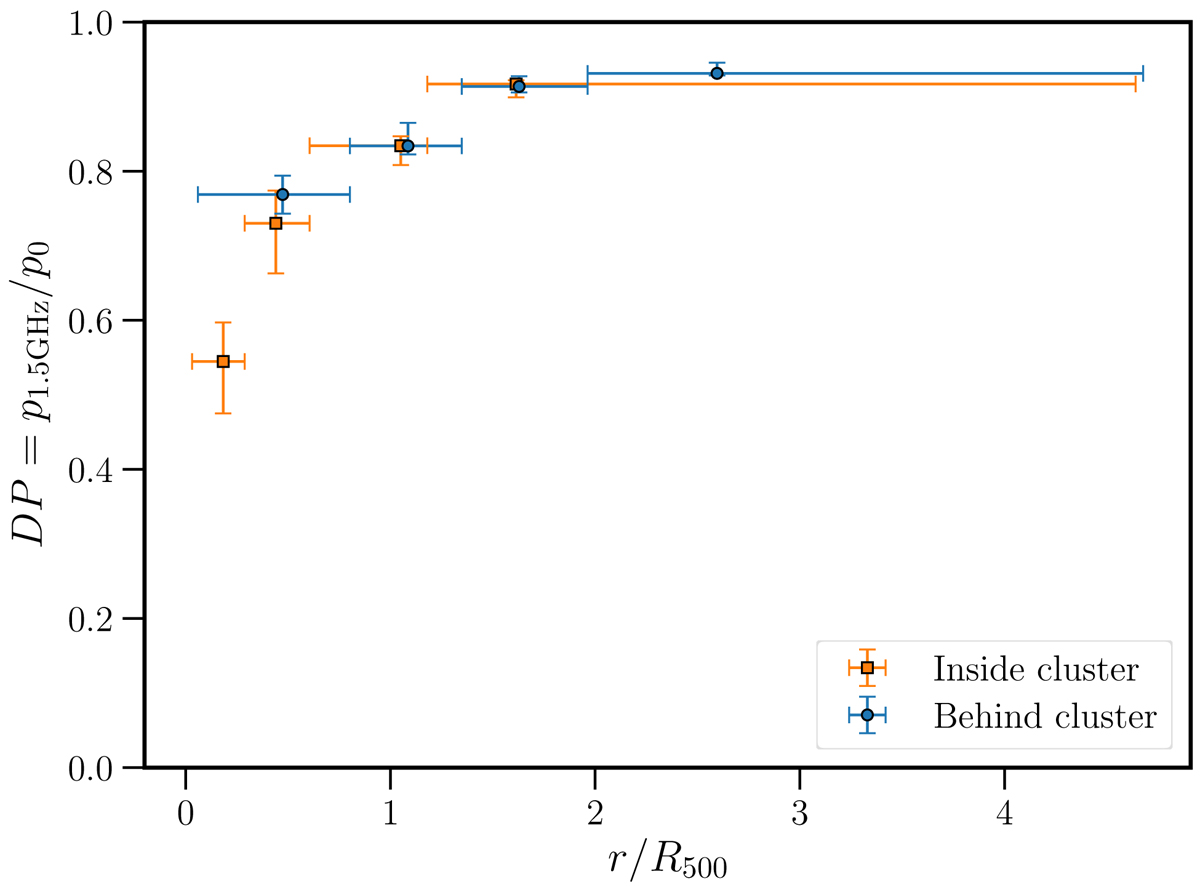
Download original image
Median depolarisation ratio in different bins of radius without incorporating upper limits from unpolarised sources. Sources inside clusters are shown in green and sources behind clusters are shown in red. Compared to Fig. 8, there is significantly less depolarisation in the lowest radius bin.
Current usage metrics show cumulative count of Article Views (full-text article views including HTML views, PDF and ePub downloads, according to the available data) and Abstracts Views on Vision4Press platform.
Data correspond to usage on the plateform after 2015. The current usage metrics is available 48-96 hours after online publication and is updated daily on week days.
Initial download of the metrics may take a while.