Open Access
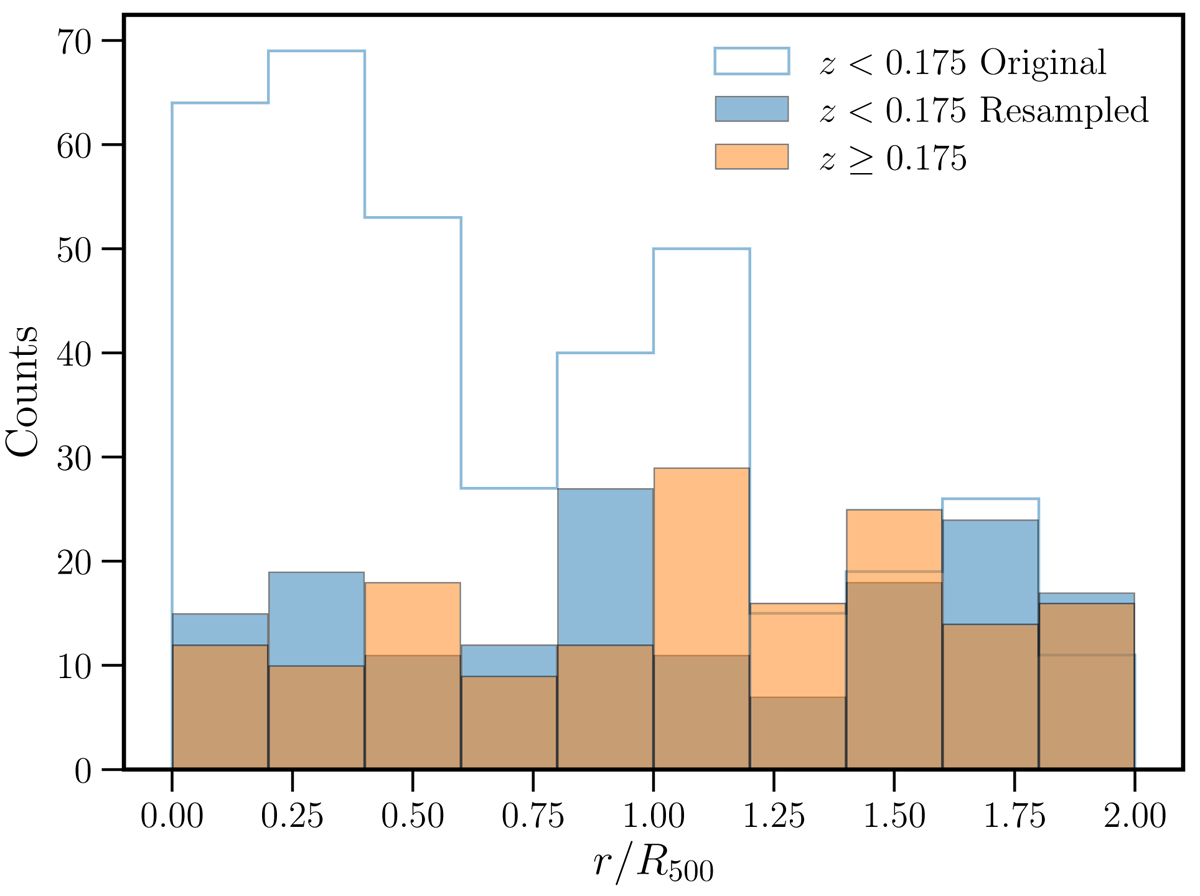
Fig. 15.
Download original image
Distribution of the projected radius of sources detected in the low and high-redshift cluster samples. The solid blue histogram shows the result of one realisation of randomly sub-sampling sources in the low-redshift cluster sample to match the distribution of sources in the high-redshift sample.
Current usage metrics show cumulative count of Article Views (full-text article views including HTML views, PDF and ePub downloads, according to the available data) and Abstracts Views on Vision4Press platform.
Data correspond to usage on the plateform after 2015. The current usage metrics is available 48-96 hours after online publication and is updated daily on week days.
Initial download of the metrics may take a while.