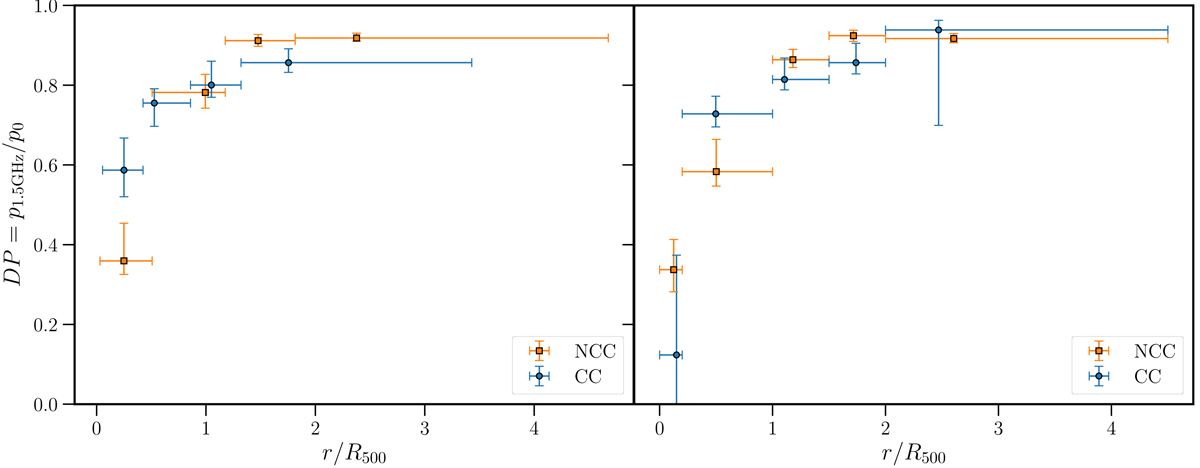
Fig. 10.
Download original image
Median of the Kaplan-Meier estimate of the depolarisation ratio survival function in different bins of radius. Cool-core clusters are shown in blue and non-cool-core clusters are shown in orange. The left panel shows bin widths (denoted by horizontal lines) chosen such that each bin contains an equal number of sources detected in polarisation and the right panel shows manually selected bins. The points are plotted at the median radius in each bin.
Current usage metrics show cumulative count of Article Views (full-text article views including HTML views, PDF and ePub downloads, according to the available data) and Abstracts Views on Vision4Press platform.
Data correspond to usage on the plateform after 2015. The current usage metrics is available 48-96 hours after online publication and is updated daily on week days.
Initial download of the metrics may take a while.