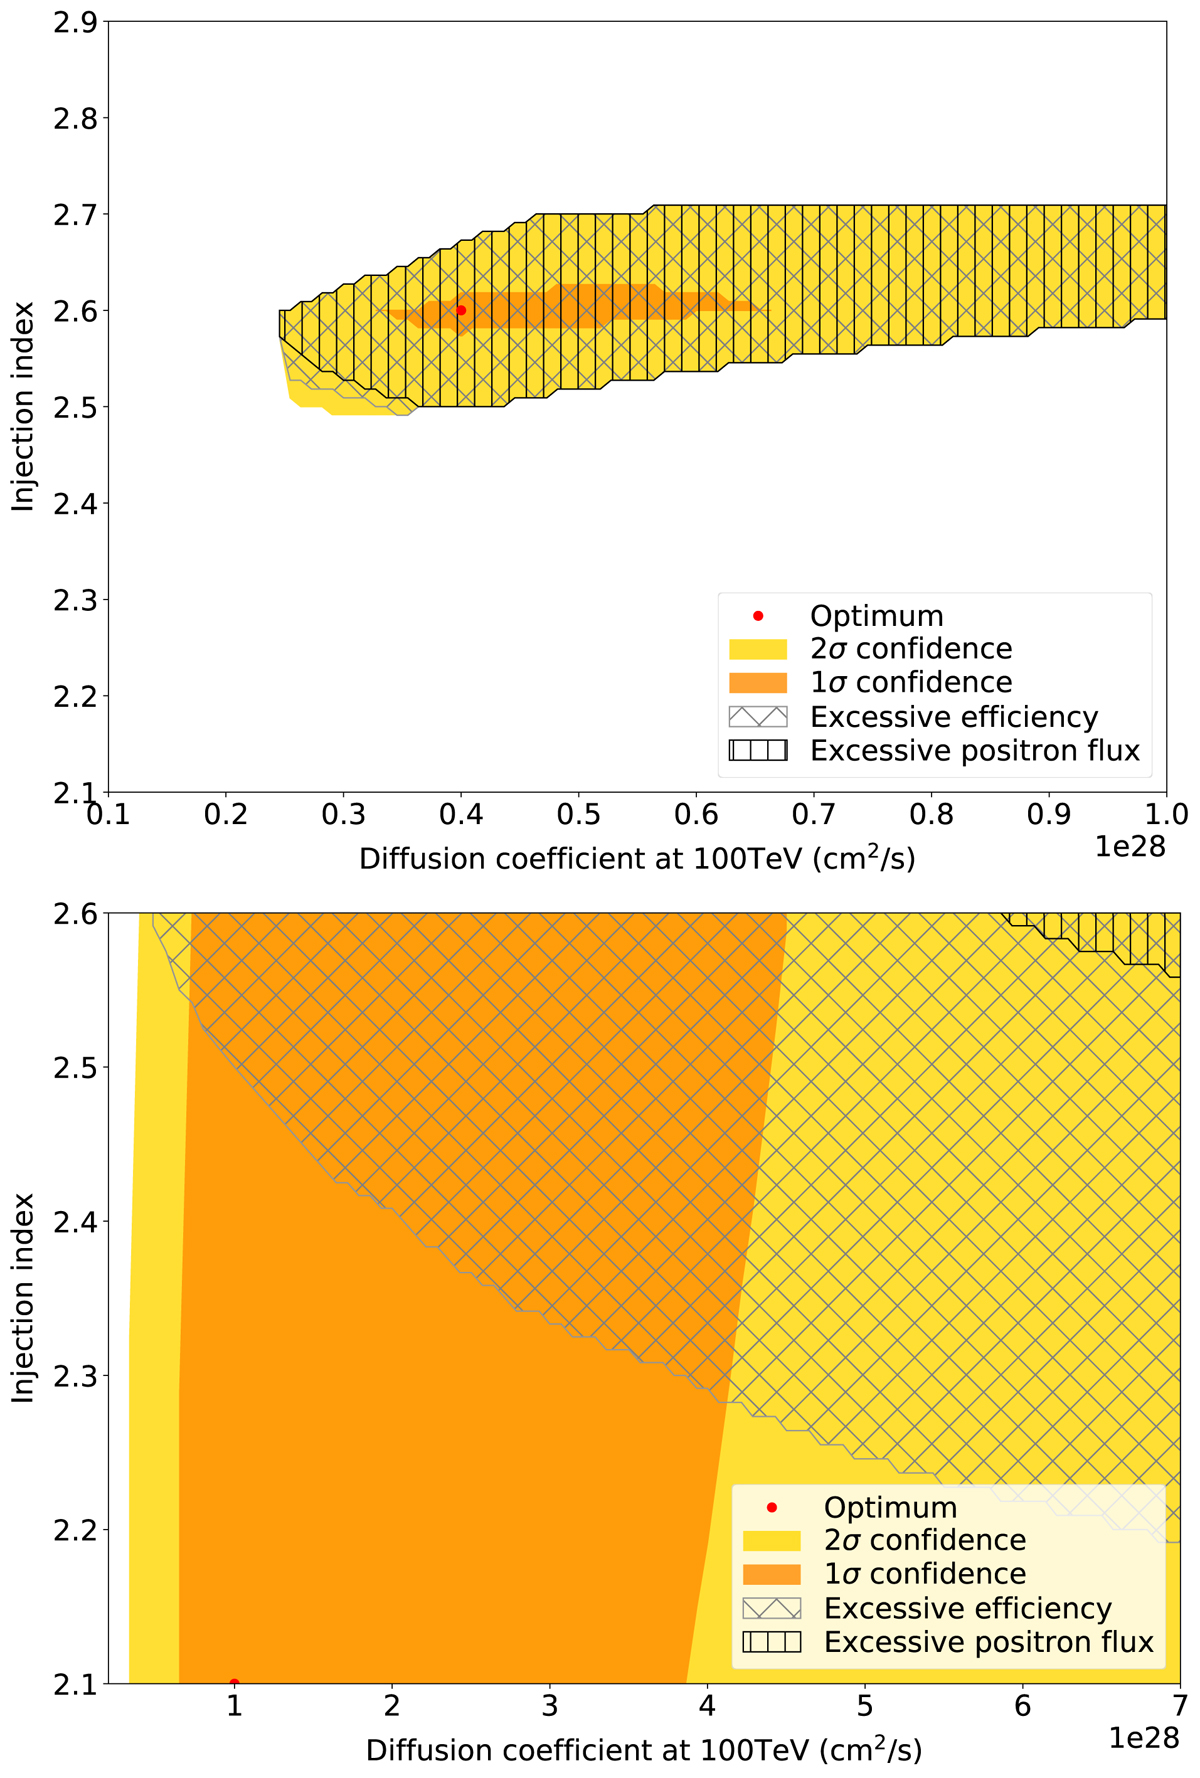
Fig. 4.
Download original image
Confidence interval in the diffusion normalization and injection index space, for model fits to HAWC+LAT data in the case of J0633+1746 (top panel), and to HAWC data only in the case of B0656+14 (bottom panel). The model setups feature a suppressed diffusion region extent of 50 pc. The color-coding indicates increasing χ2 variations from the optimum of up to 1 and 4 in the orange and yellow regions, respectively. The black vertical hatches indicate the model fits yielding positron fluxes in excess of the AMS-02 measurement in the 0.1−1 TeV range, while the gray slanting hatches indicate model fits implying injection efficiencies in excess of 100% of the spin-down power.
Current usage metrics show cumulative count of Article Views (full-text article views including HTML views, PDF and ePub downloads, according to the available data) and Abstracts Views on Vision4Press platform.
Data correspond to usage on the plateform after 2015. The current usage metrics is available 48-96 hours after online publication and is updated daily on week days.
Initial download of the metrics may take a while.