Fig. 5
Download original image
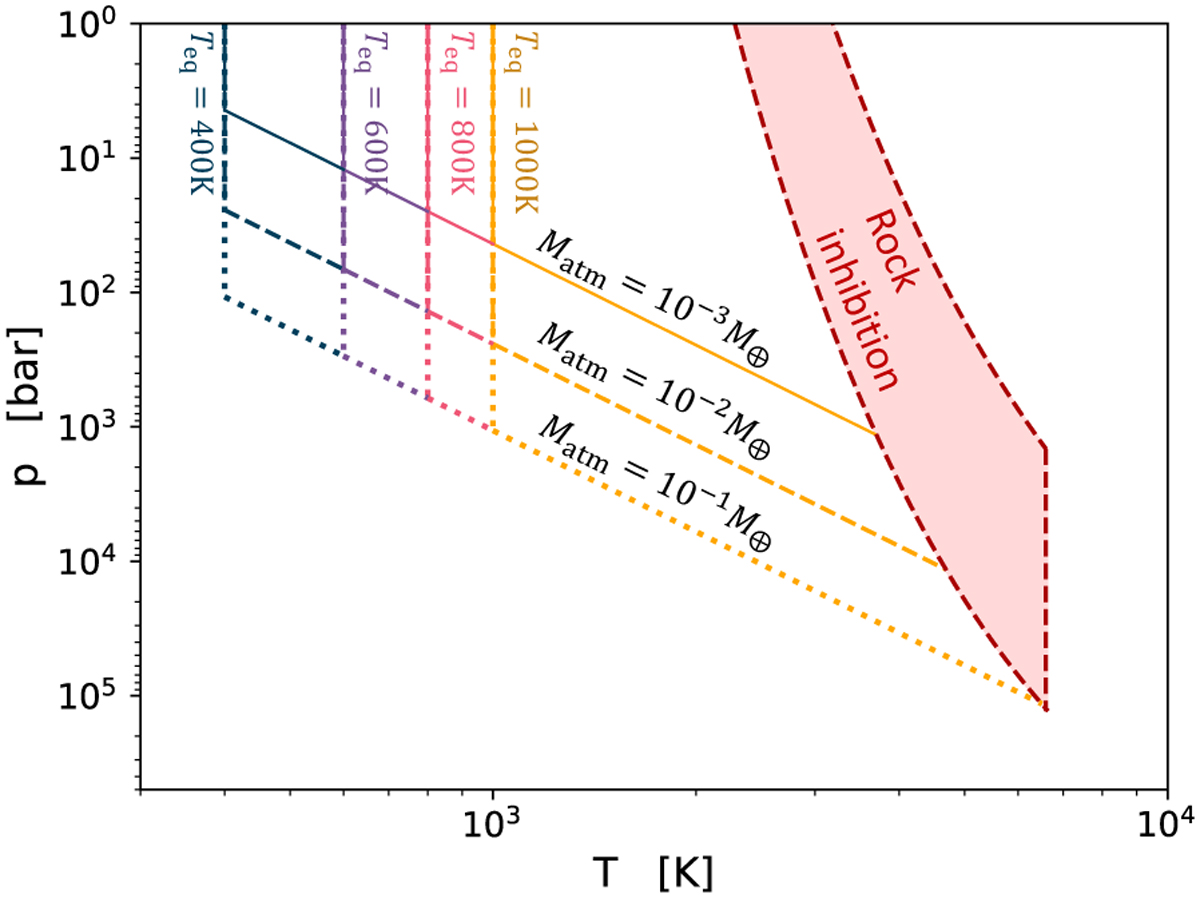
Envelope pressure–temperature profiles for a sample of envelope properties. The blue and red curves represent the temperature at the top and bottom of the stable layer, respectively; for a saturated gas mixture, convection is shut off between the blue and red curves. In the absence of data, this figure assumes xs = ps/p and does not consider the temperature dependence of latent heat or the compositional dependence of the critical curve. See Fig. 7 for a conceptual sketch of the temperature structure below the envelope.
Current usage metrics show cumulative count of Article Views (full-text article views including HTML views, PDF and ePub downloads, according to the available data) and Abstracts Views on Vision4Press platform.
Data correspond to usage on the plateform after 2015. The current usage metrics is available 48-96 hours after online publication and is updated daily on week days.
Initial download of the metrics may take a while.