Fig. 3
Download original image
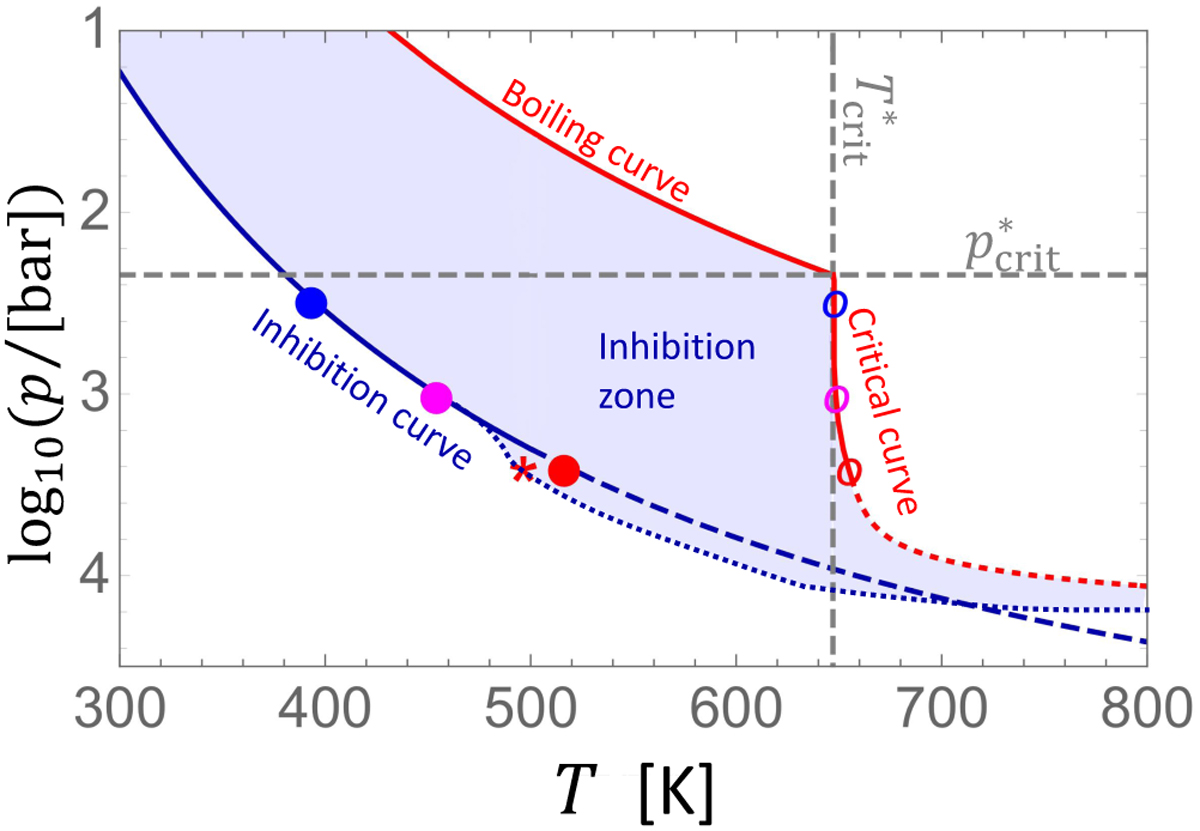
Temperature at the boundaries of the stable layer as a function of envelope basal pressure, using water. The blue and red curves correspond to the top and bottom of the stable layer respectively. As in Fig. 2, we use solid curves where we have data and dashed curves for the ideal gas approximation. We further use a dotted curve for the interpolated critical curve and for a notional (non-quantitative) altered inhibition curve that accounts for the non-ideal coexistence behavior of the water–hydrogen system. The intersection marker symbols from Fig. 2 (the blue, magenta, and red filed and open circles and the red star) are shown here for context.
Current usage metrics show cumulative count of Article Views (full-text article views including HTML views, PDF and ePub downloads, according to the available data) and Abstracts Views on Vision4Press platform.
Data correspond to usage on the plateform after 2015. The current usage metrics is available 48-96 hours after online publication and is updated daily on week days.
Initial download of the metrics may take a while.