Fig. 2
Download original image
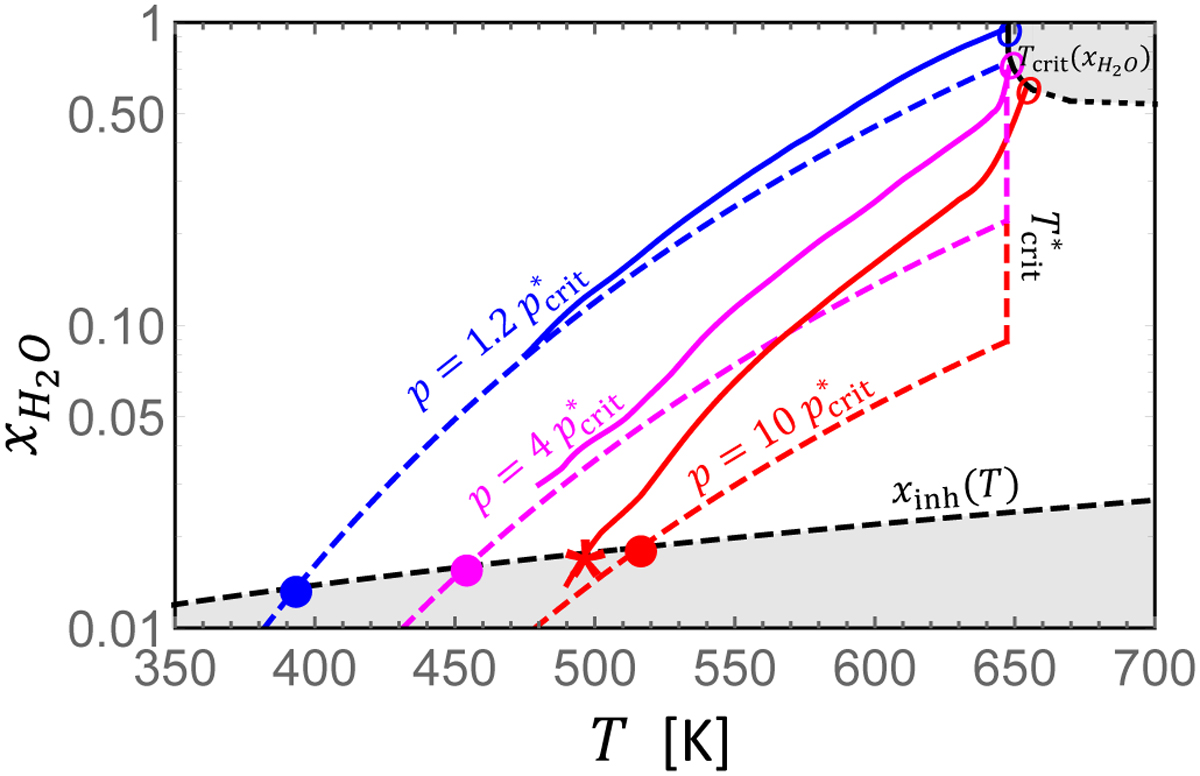
Illustration showing the stable layer boundaries in (x, T) space. Solid curves use data (Seward & Franck 1981, see Sect. 2.3), while dashed curves use the ideal gas approximation x = ps/p, diverging near the critical endpoint. Gray shaded areas are regions of parameter space wherein free convection is permitted. In the top-right corner, the gray region lies beyond the critical curve where phase separation does not occur. At the bottom of the figure, the gray region lies below the xinh curve described in Eq. (2). Blue, magenta, and red curves represent hydrostatic pressure environments of 300 bars, 1 and 2.5 kbars respectively. The solid points where the dashed curves intersect correspond to the top of the stable layer under the ideal gas approximation; the red asterisk shows the offset intersection using data. The open circles where the solid colored curves intersect the critical curve represent the top of the core.
Current usage metrics show cumulative count of Article Views (full-text article views including HTML views, PDF and ePub downloads, according to the available data) and Abstracts Views on Vision4Press platform.
Data correspond to usage on the plateform after 2015. The current usage metrics is available 48-96 hours after online publication and is updated daily on week days.
Initial download of the metrics may take a while.