Fig. B.1.
Download original image
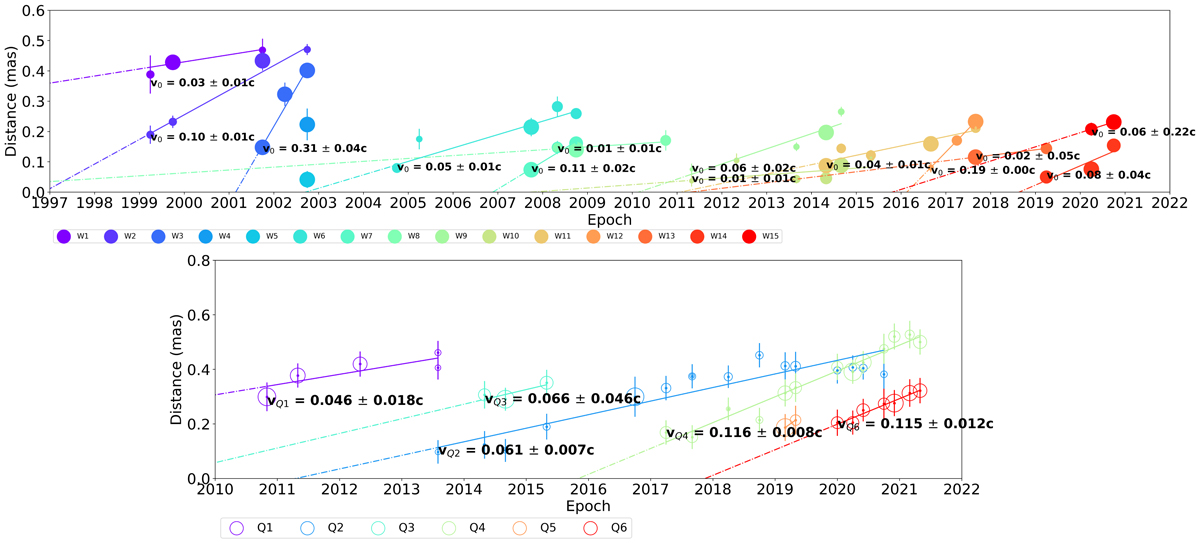
Plot of motion of all colour-coded features. Top: Motion of the 86 GHz features identified through all available epochs. The velocity fit with the uncertainty is displayed above the first occurrence of each feature. The size of each feature is normalised to the flux of the central feature (C) of that epoch. The velocities are also given in Table F.7. Bottom: Same as above, but for the 43 GHz features. The velocities are also given in Table F.8.
Current usage metrics show cumulative count of Article Views (full-text article views including HTML views, PDF and ePub downloads, according to the available data) and Abstracts Views on Vision4Press platform.
Data correspond to usage on the plateform after 2015. The current usage metrics is available 48-96 hours after online publication and is updated daily on week days.
Initial download of the metrics may take a while.