Fig. 8.
Download original image
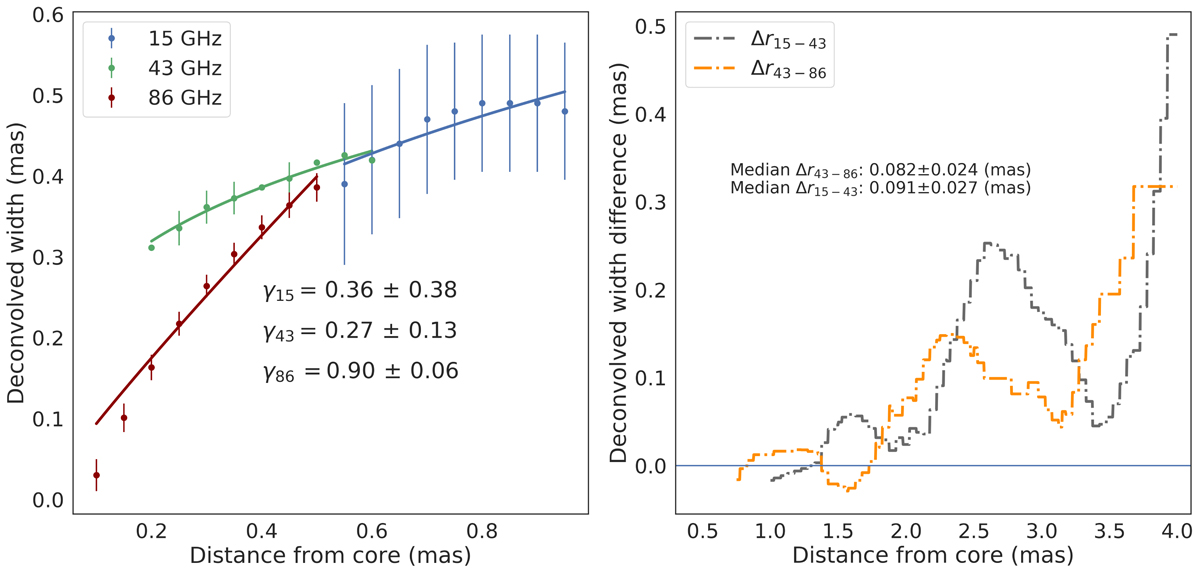
Deconvolved jet width and jet width difference as a function of the distance from the core. Left: deconvolved jet width as a function of the distance (projected) from the VLBI core at 15, 43, and 86 GHz. The blue, green, and red markers correspond to slices taken from the 15, 43, and 86 GHz images shown in Figs. 6 and F.1, respectively. The corresponding solid lines mark the power-law fits with their indices: γ15 = 0.36 ± 0.38, γ43 = 0.27 ± 0.13, and γ86 = 0.90 ± 0.06 (see Table F.12). All slices are drawn parallel to the abscissa and are evenly spaced at 50 μas apart. We note that the 86 GHz data points might be indicating a lower limit for the jet width due to dynamic range limitations. Right: difference between the jet width at 15 GHz and 43 GHz (Δr15 − 43; dashed grey line) and 43 GHz and 86 GHz (Δr43 − 86; dashed orange line). In both cases, the median values Δr15 − 43 and Δr43 − 86 are positive.
Current usage metrics show cumulative count of Article Views (full-text article views including HTML views, PDF and ePub downloads, according to the available data) and Abstracts Views on Vision4Press platform.
Data correspond to usage on the plateform after 2015. The current usage metrics is available 48-96 hours after online publication and is updated daily on week days.
Initial download of the metrics may take a while.