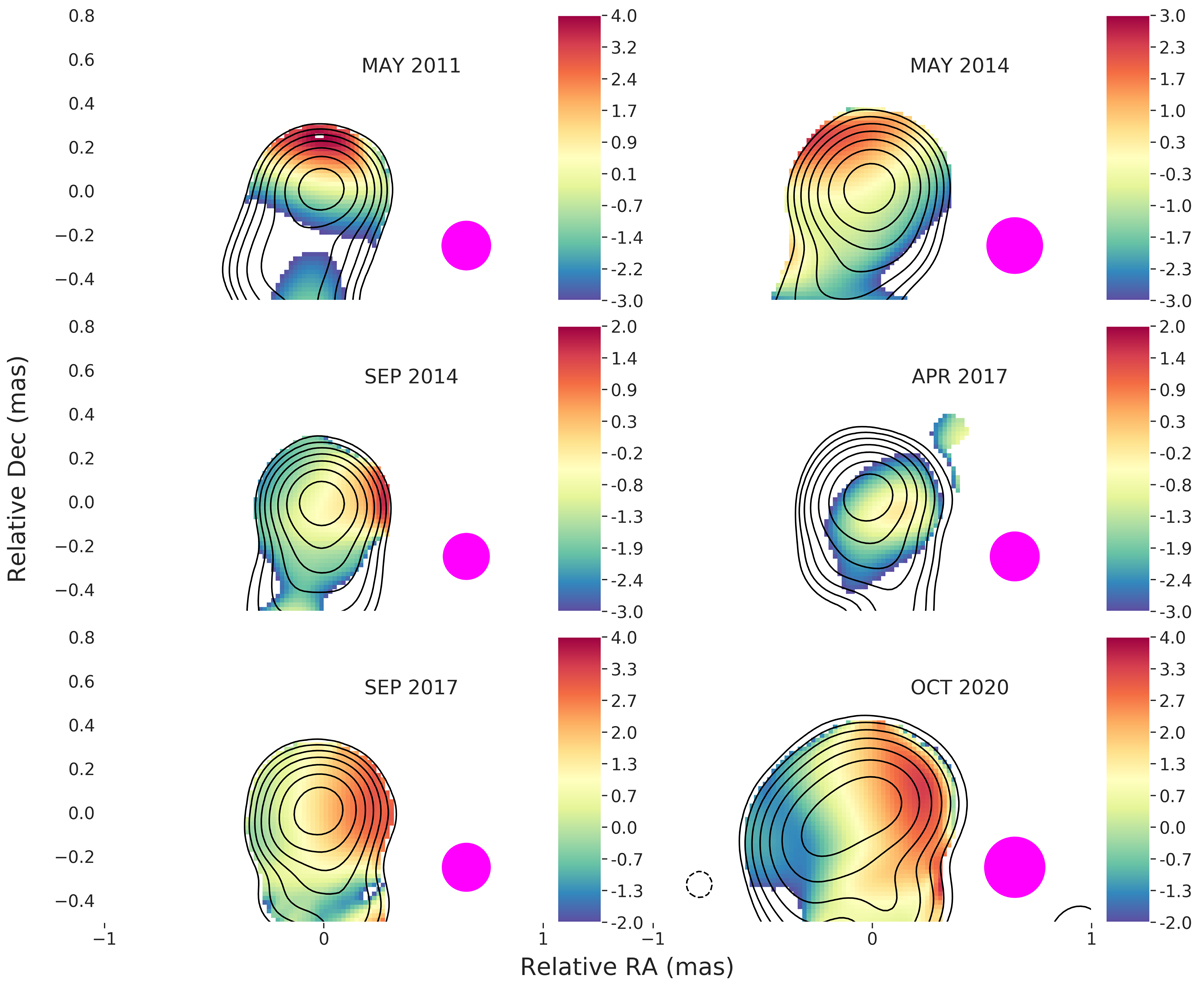
Fig. 7.
Download original image
Spectral index map of selected epochs. The contour levels were set at −1%, 1%, 2%, 4%, 8%, 16%, 32%, and 64% of the intensity peak at each epoch. The total intensity cut-off was set at 50σ. The limiting values for the spectral indices are indicated in the colour bars beside each panel. A summary of the image parameters is presented in Table F.10. The corresponding spectral index uncertainty maps are presented in Fig. D.1.
Current usage metrics show cumulative count of Article Views (full-text article views including HTML views, PDF and ePub downloads, according to the available data) and Abstracts Views on Vision4Press platform.
Data correspond to usage on the plateform after 2015. The current usage metrics is available 48-96 hours after online publication and is updated daily on week days.
Initial download of the metrics may take a while.