Fig. 4.
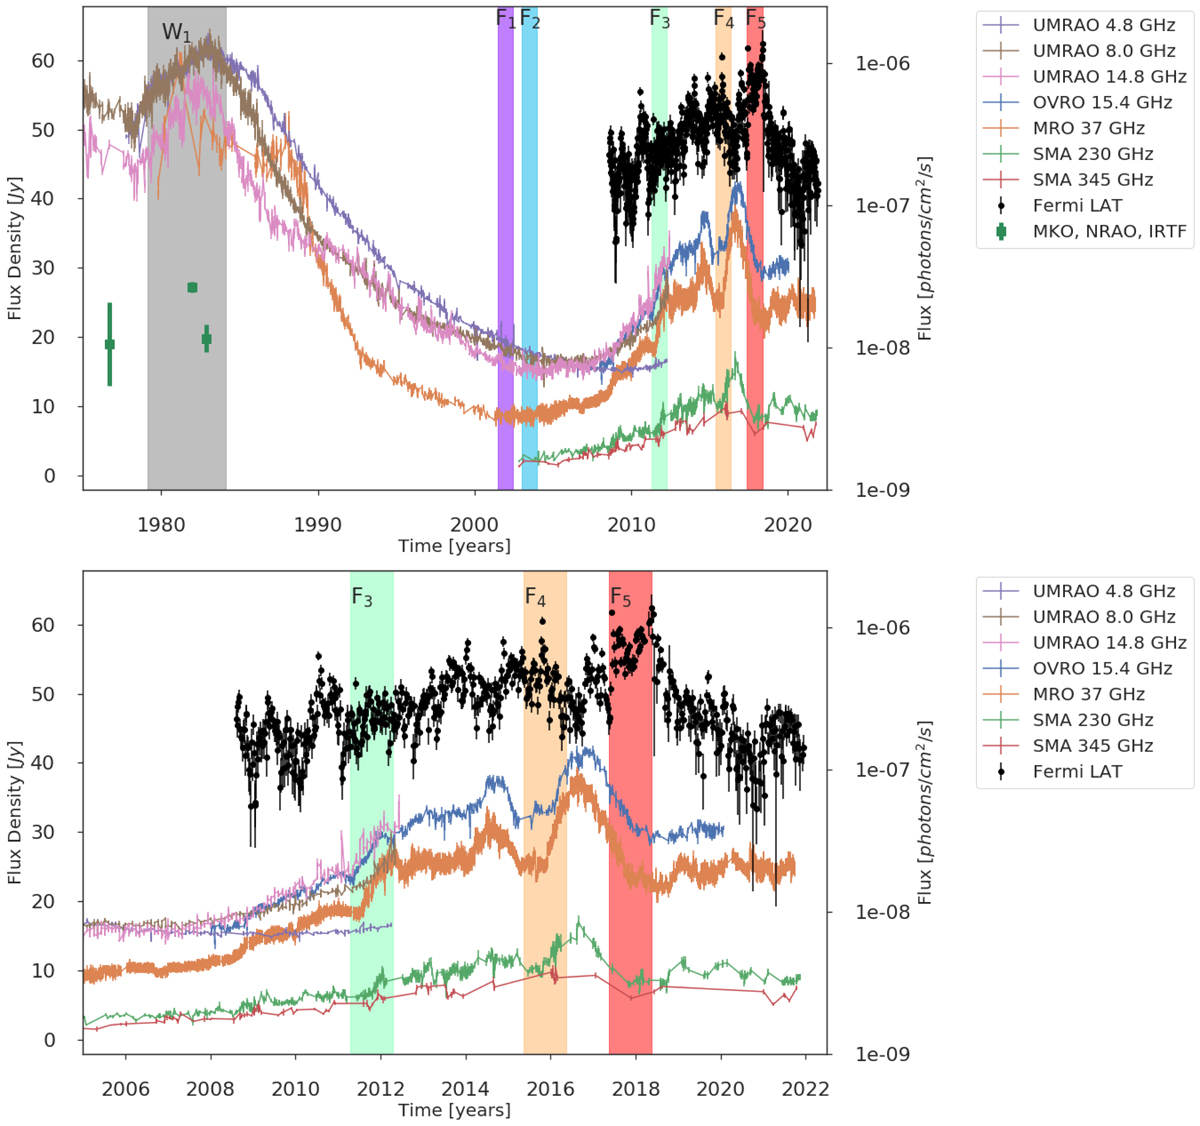
Download original image
Total variability radio light curves and γ-ray flux. Top: presented here are radio light curves of 3C 84 from 1980 to 2020 at 4.8, 8.0, 14.8, 15, 37, 230, and 345 GHz (in order of appearance in the legend). The black data points correspond to γ-ray flux. The dark-green data points are individual, historical, total flux measurements. The grey shaded area at the onset of the total intensity peak around 1983 could tentatively be connected to the ejection of feature W1, which may correspond to the prominent C2 region identified in later maps. The five other shaded areas are colour-coded in response to the cross-identified features F1 through F5, as described in Fig. 3, and denote the approximate ejection time. Bottom: zoomed-in version of the top panel showing the years 2005–2022.
Current usage metrics show cumulative count of Article Views (full-text article views including HTML views, PDF and ePub downloads, according to the available data) and Abstracts Views on Vision4Press platform.
Data correspond to usage on the plateform after 2015. The current usage metrics is available 48-96 hours after online publication and is updated daily on week days.
Initial download of the metrics may take a while.