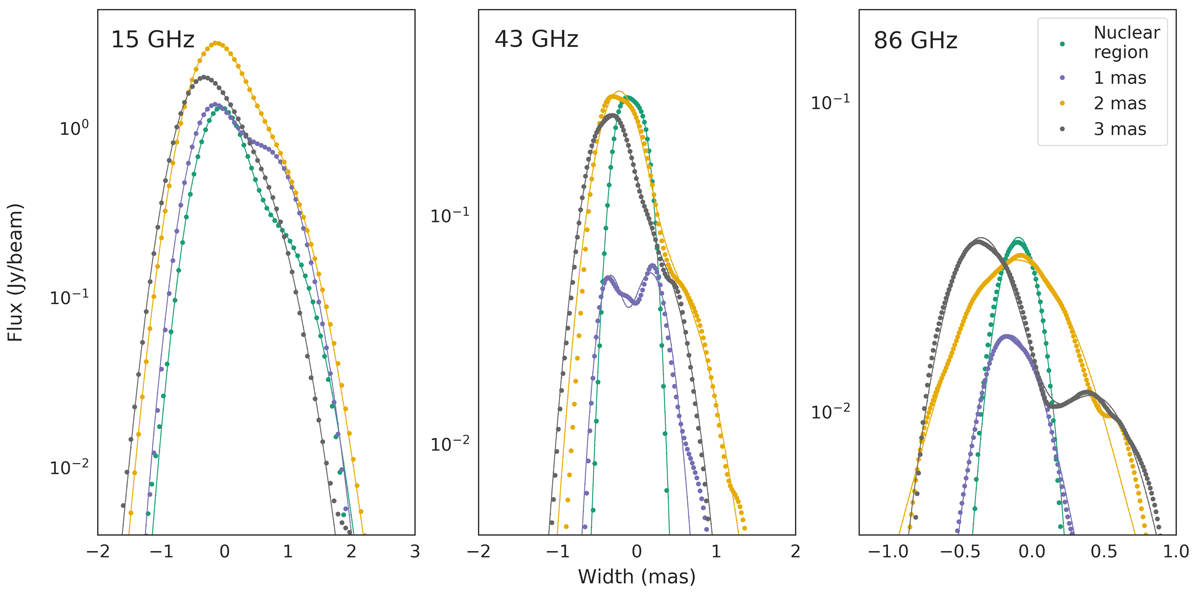
Fig. C.1.
Download original image
Representative transverse jet profiles (dots) and single and double Gaussian function fits (continuous lines) at 15, 43, and 86 GHz. Different colours represent slices in the nuclear region (z0 = 0.6 mas at 15 GHz; z0 = 0.4 mas at 43 and 86 GHz) and at separations of z0 = 1 mas, 2 mas, and 3 mas from the core, with the colour-coding as displayed in the figure legend.
Current usage metrics show cumulative count of Article Views (full-text article views including HTML views, PDF and ePub downloads, according to the available data) and Abstracts Views on Vision4Press platform.
Data correspond to usage on the plateform after 2015. The current usage metrics is available 48-96 hours after online publication and is updated daily on week days.
Initial download of the metrics may take a while.