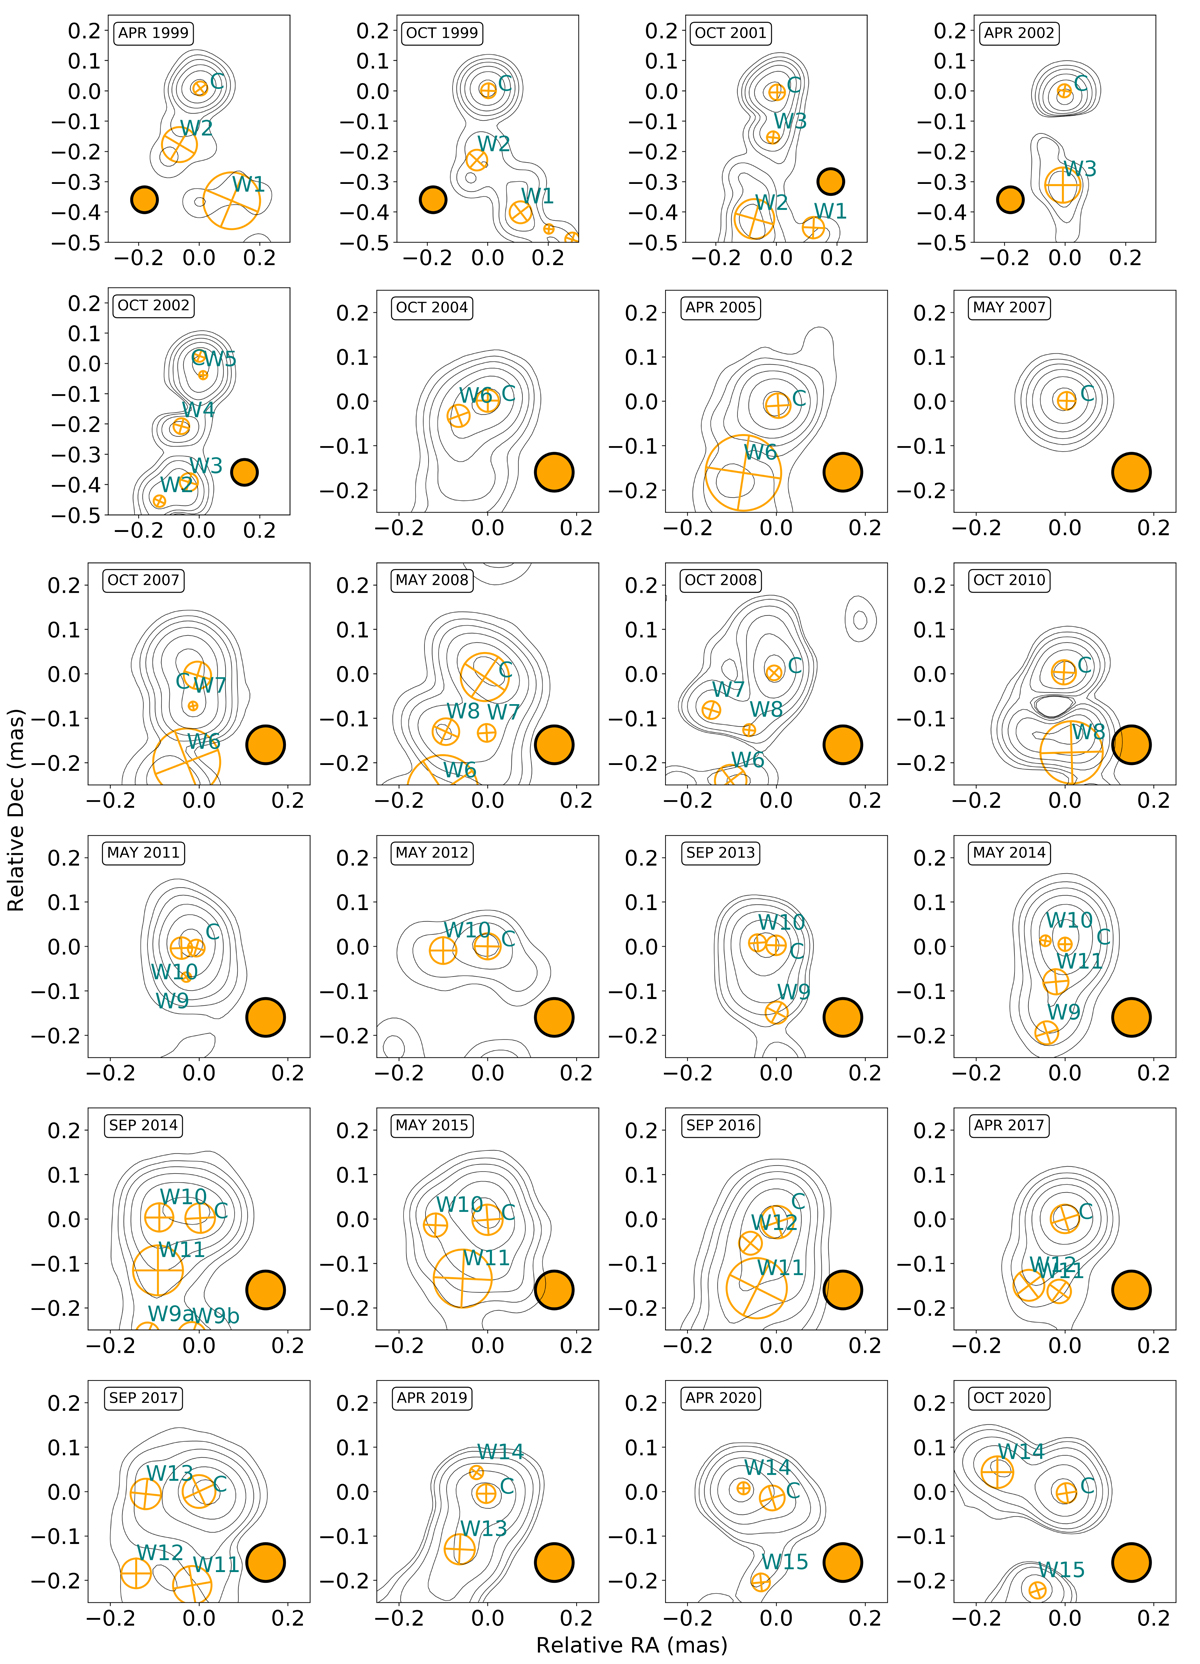
Fig. 1.
Download original image
Circular Gaussian components super-imposed on 86 GHz CLEAN images. The legend of each panel indicates the epoch at which the observations were obtained. The beam of each epoch is displayed in the panels as a filled orange circle. The contour levels correspond to 3%, 5%, 10%, 20%, 40%, and 80% of the intensity peak for all epochs, except May 2012, where 10%, 20%, 40%, and 80% of the intensity peak were used because the data quality was limited. The epochs are convolved with the same circular beam with a radius of 0.088 mas. This radius size was obtained by geometrically averaging the beam sizes of all displayed epochs. A summary of the beam parameters of each individual epoch and peak fluxes is provided in Table F.1. Each feature is labelled based on its date of emergence, with the lower number indicating an earlier ejection time. As a centre of alignment, we always used the north-westernmost feature inside the core region, which we labelled ‘C’. We note that feature ‘W2’ was detectable in the April 2002 epoch and feature ‘W6’ was not detectable in the May 2007 epoch due to S/N limitations. A summary of the characteristics of each feature is provided in Table F.5.
Current usage metrics show cumulative count of Article Views (full-text article views including HTML views, PDF and ePub downloads, according to the available data) and Abstracts Views on Vision4Press platform.
Data correspond to usage on the plateform after 2015. The current usage metrics is available 48-96 hours after online publication and is updated daily on week days.
Initial download of the metrics may take a while.