Fig. 9.
Download original image
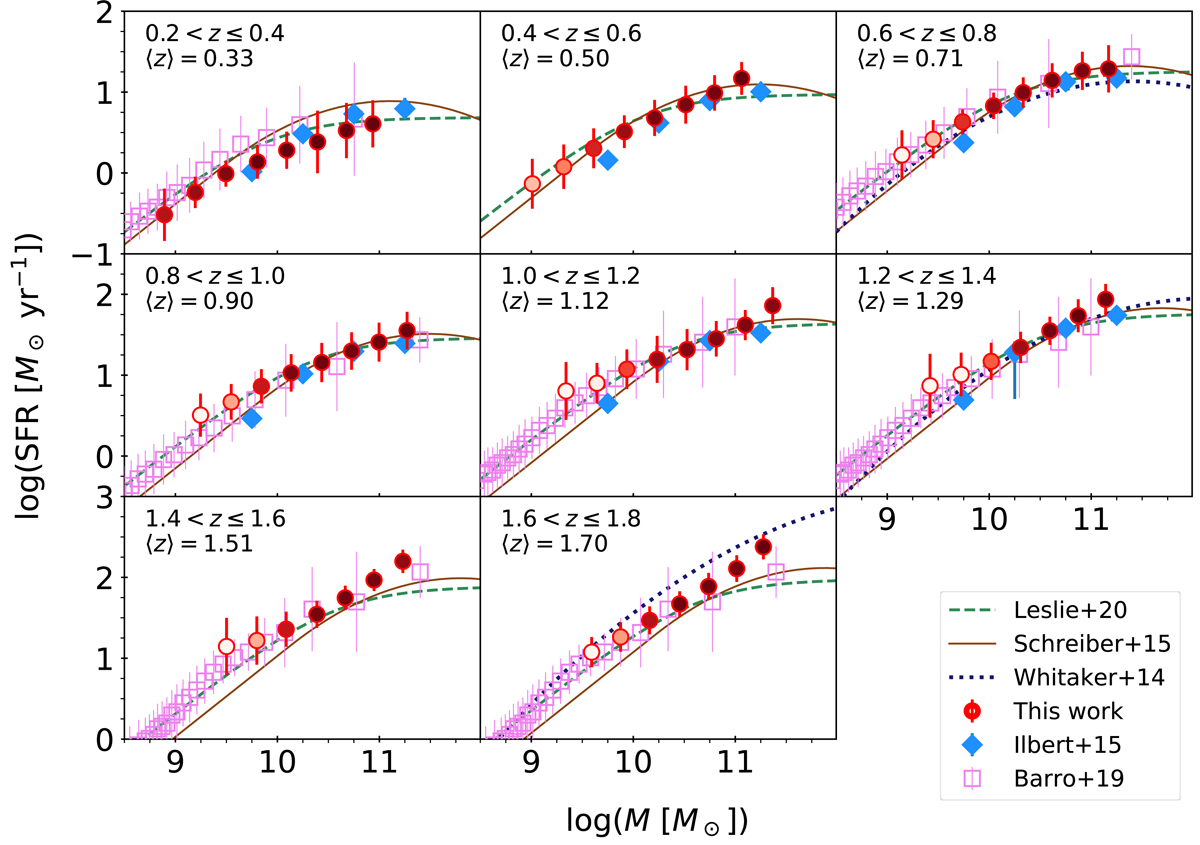
Redshift evolution of the MS of star forming galaxies (see Sect. 4.3) as determined in the present work (red circles), Ilbert et al. (2015, blue diamonds), Barro et al. (2019, pink squares), Whitaker et al. (2014, blue dotted line), Schreiber et al. (2015, brown solid line), and Leslie et al. (2020, green dashed line). Our estimates stop at the z-dependent threshold for stellar mass completeness defined in Weaver et al. (2022). Their error bars are the 16th–84th percentile range and each symbol is filled with a shade of red according to the completeness of the given mass bin; in particular, dark red symbols represent > 90% completeness, orange between 60 and 80%, while white-filled circles have ≲50% completeness (see Sect. 5.2). Results from the literature are shown only when the median redshift of the given study is sufficiently close to ours (which is indicated in the upper-left corner of each panel); the same measure may be repeated in more than one panel: for example, the MS of Barro et al. (2019) at 0.5 < z < 1 has a median redshift ⟨z⟩=0.8 and it is compared to our data both at 0.6 < z < 0.8 and 0.8 < z < 1.0.
Current usage metrics show cumulative count of Article Views (full-text article views including HTML views, PDF and ePub downloads, according to the available data) and Abstracts Views on Vision4Press platform.
Data correspond to usage on the plateform after 2015. The current usage metrics is available 48-96 hours after online publication and is updated daily on week days.
Initial download of the metrics may take a while.