Fig. 7.
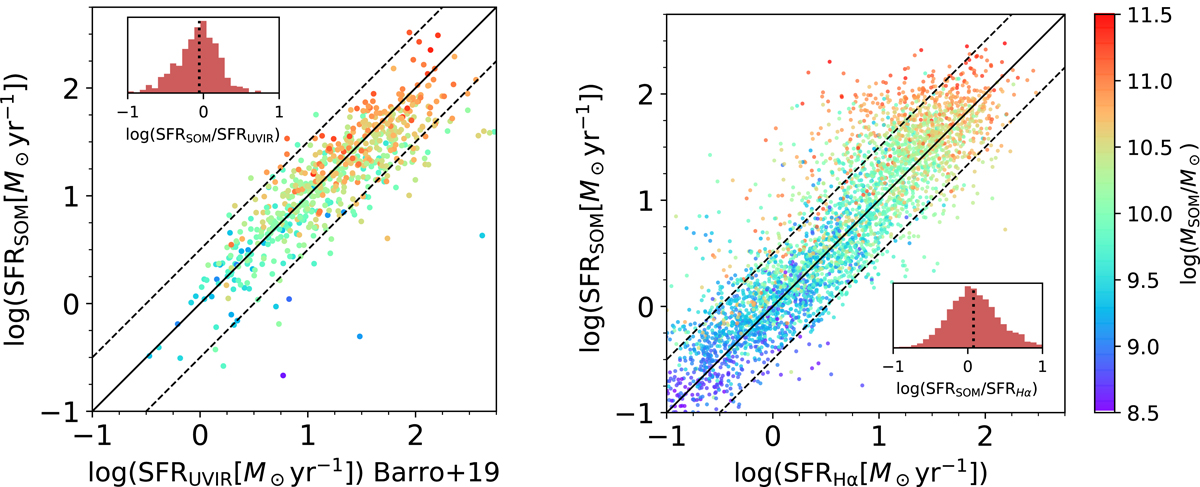
Download original image
Quality assessments of the SFRSOM estimates using independent measurements from the literature as “ground truth”. Left panel: comparison between SFRSOM and the template-based estimates from Barro et al. (2019, SFRUVIR) for 608 galaxies at z < 1.8 in the SXDF-CANDELS area (colored dots). For sake of consistency, the Barro et al. (2019) estimates are converted to the same reference system of Ilbert et al. (2015), since the latter has also been used to calibrate the SOM method (see Appendix A). Right panel: comparison to another star formation estimator, that is, Hα nebular emission line. In this case the comparison is performed in COSMOS, for 3718 galaxies (colored dots). In both panels, the color palette from violet to red indicates the stellar mass of each galaxy according to the SOM method; the solid line is the 1:1 relation from which two dashed lines are set at a distance of ±0.3 dex. Each panel also includes an inset that quantifies the dispersion between SFRSOM and the alternate estimate (red histogram); the vertical dotted line marks the median offset, which is −0.05 dex for log(SFRSOM/SFRUVIR) and 0.07 dex for log(SFRSOM/SFRUVIR).
Current usage metrics show cumulative count of Article Views (full-text article views including HTML views, PDF and ePub downloads, according to the available data) and Abstracts Views on Vision4Press platform.
Data correspond to usage on the plateform after 2015. The current usage metrics is available 48-96 hours after online publication and is updated daily on week days.
Initial download of the metrics may take a while.