Open Access
Fig. 3.
Download original image
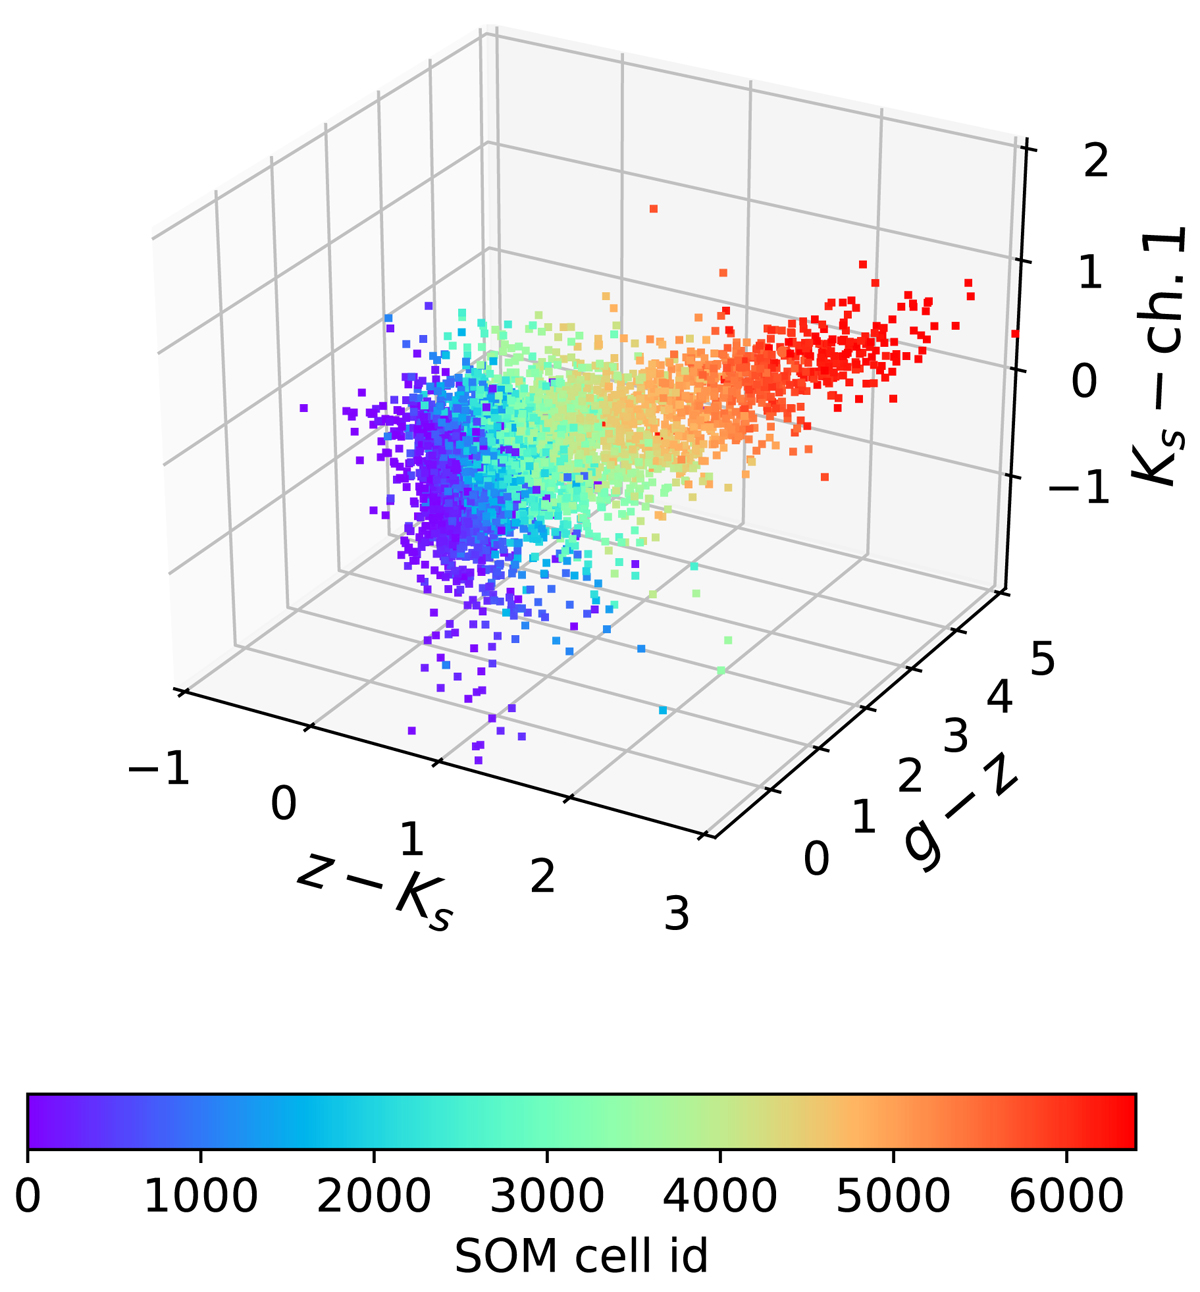
Illustration of the relationship between input features and the SOM classification (made by the so-called “cells”). This simplified example shows only three broadband colors in the observer’s frame, for a random subsample of 10 000 COSMOS2020 galaxies.
Current usage metrics show cumulative count of Article Views (full-text article views including HTML views, PDF and ePub downloads, according to the available data) and Abstracts Views on Vision4Press platform.
Data correspond to usage on the plateform after 2015. The current usage metrics is available 48-96 hours after online publication and is updated daily on week days.
Initial download of the metrics may take a while.