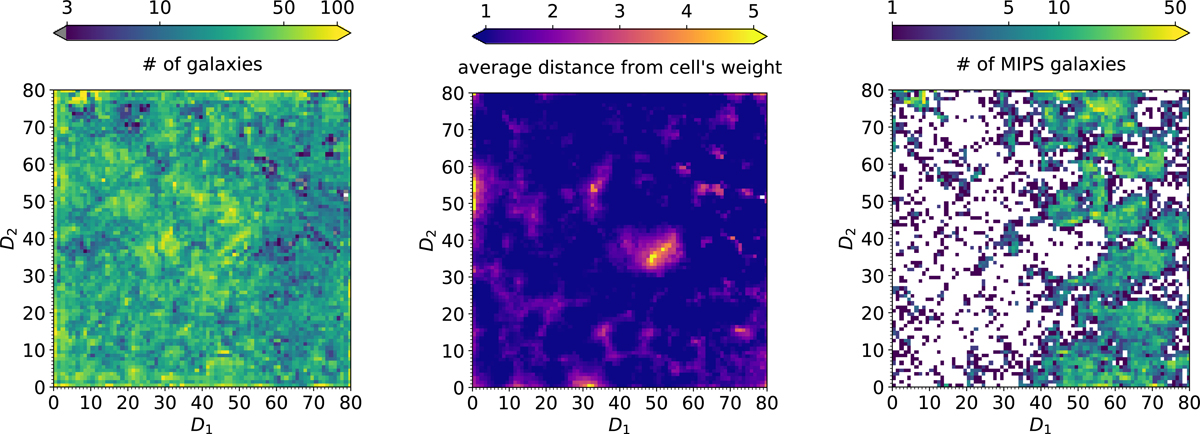
Fig. 2.
Download original image
SOM of COSMOS2020 galaxies at z < 1.8, selected as described in Sect. 3.1. The same grid is color-coded in three different ways, to show the number of galaxies per cell (left panel), the similarity between galaxies in a given cell and the correspondent SOM weight (middle panel), and the MIPS-detected objects with MLePh > 1010 M⊙ (right panel). In each grid, empty cells are white. Left: handful of cells with only one or two objects are colored in gray. Middle: similarity is quantified by means of Eq. (2). Throughout this work, the dimensions of the 2D grid are arbitrarily labeled D1 and D2 since they have no physical meaning.
Current usage metrics show cumulative count of Article Views (full-text article views including HTML views, PDF and ePub downloads, according to the available data) and Abstracts Views on Vision4Press platform.
Data correspond to usage on the plateform after 2015. The current usage metrics is available 48-96 hours after online publication and is updated daily on week days.
Initial download of the metrics may take a while.