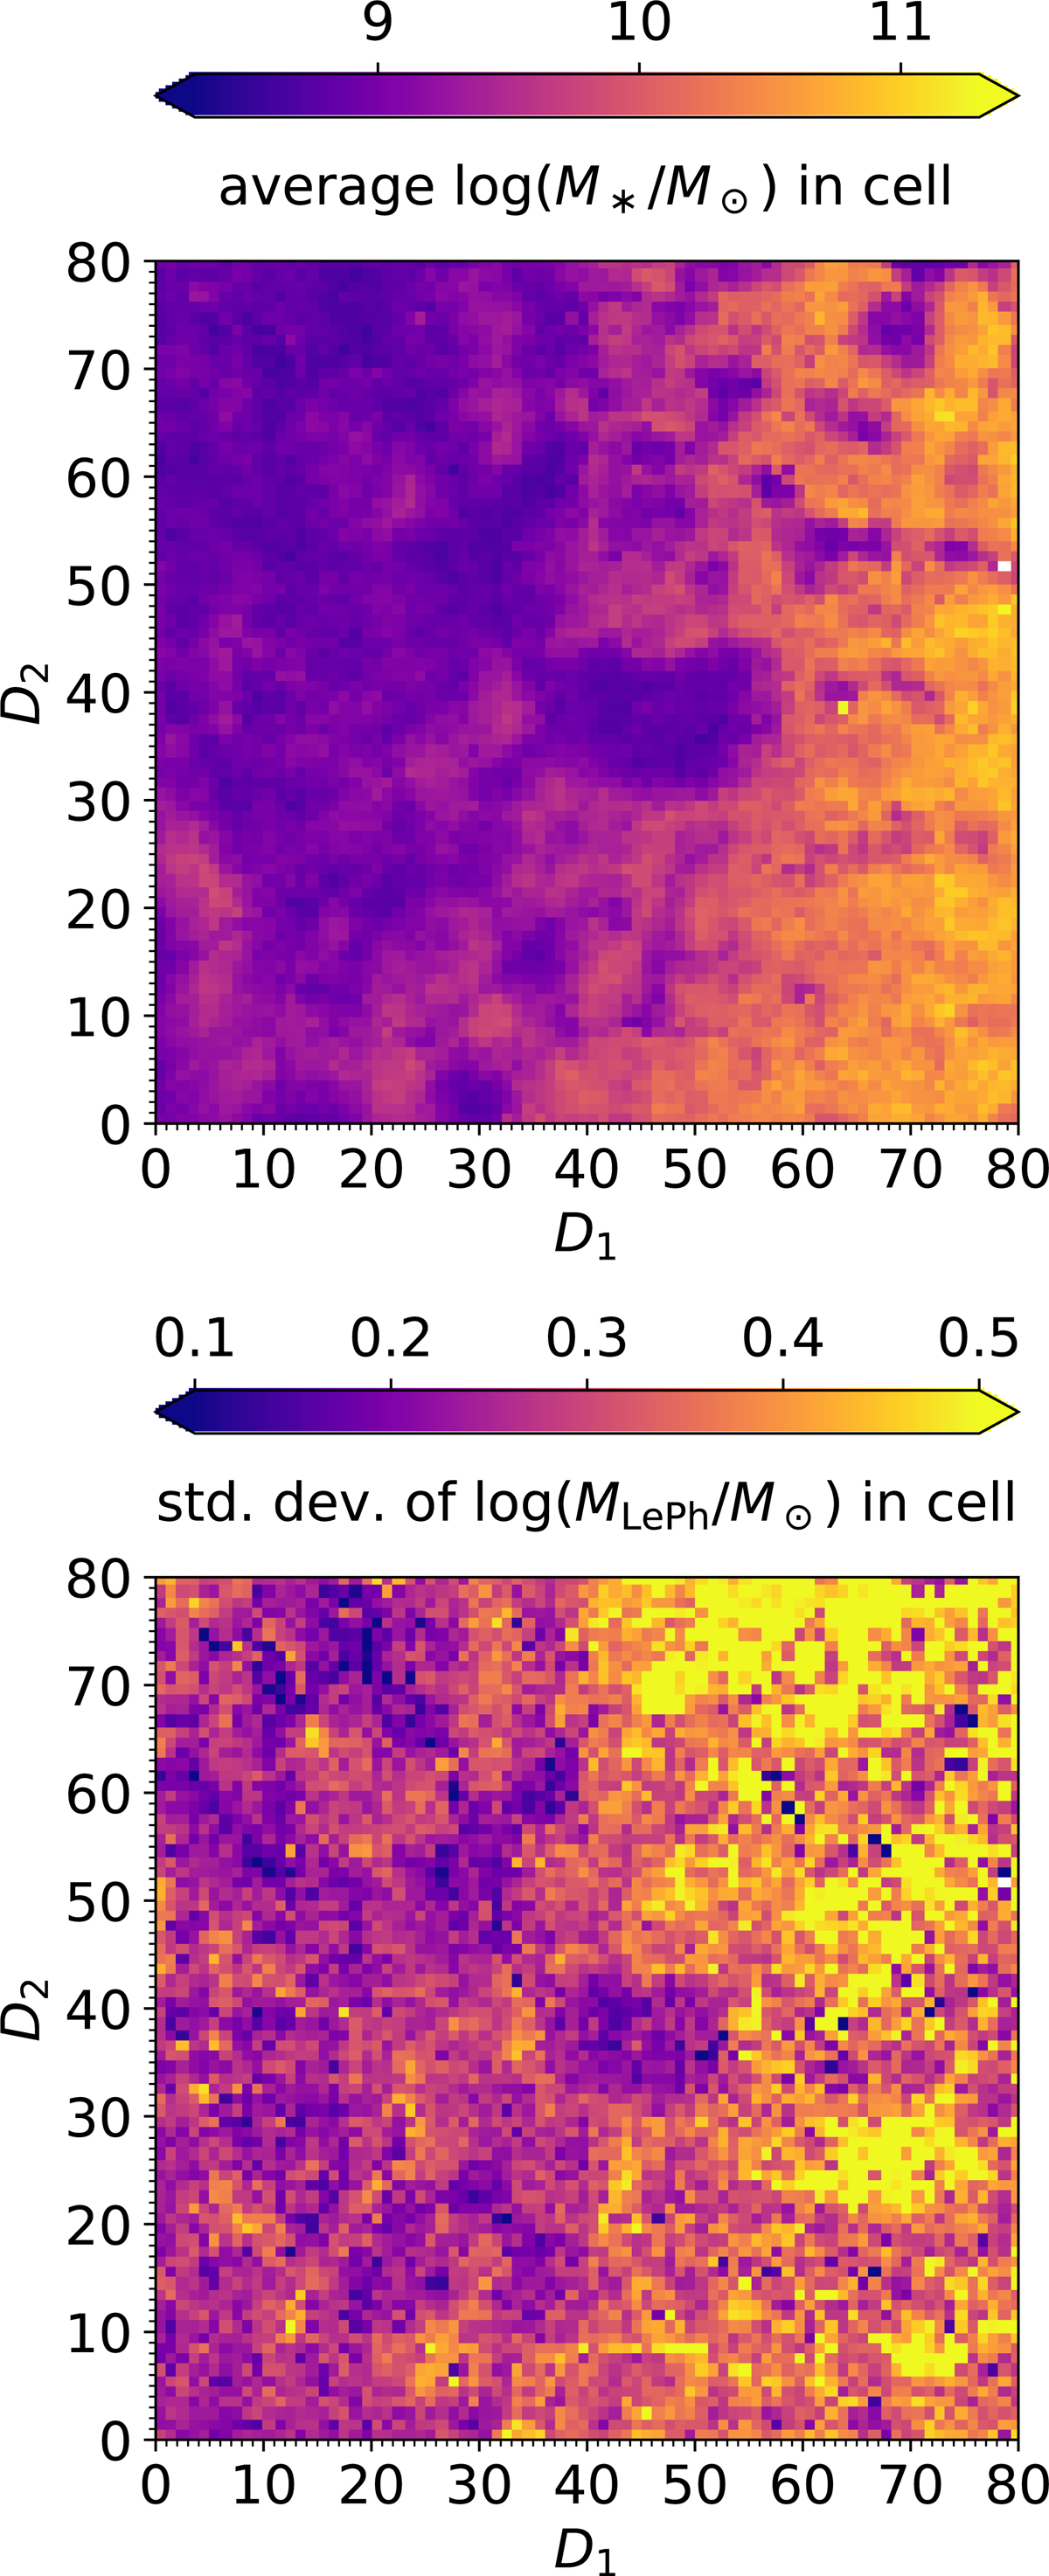
Fig. B.3.
Download original image
A more detailed description of how galaxies with different stellar masses are distributed across the SOM. Upper panel: Average log(MLePh/M⊙) of COSMOS2020 galaxies within the same cell, coded according to the color bar above the SOM grid (white cells are empty). Upper panel: Standard deviation of the same log(MLePh/M⊙) distribution per individual cell, coded according to the color bar above the SOM grid (also in this case, empty cells are colored in white).
Current usage metrics show cumulative count of Article Views (full-text article views including HTML views, PDF and ePub downloads, according to the available data) and Abstracts Views on Vision4Press platform.
Data correspond to usage on the plateform after 2015. The current usage metrics is available 48-96 hours after online publication and is updated daily on week days.
Initial download of the metrics may take a while.