Fig. B.2.
Download original image
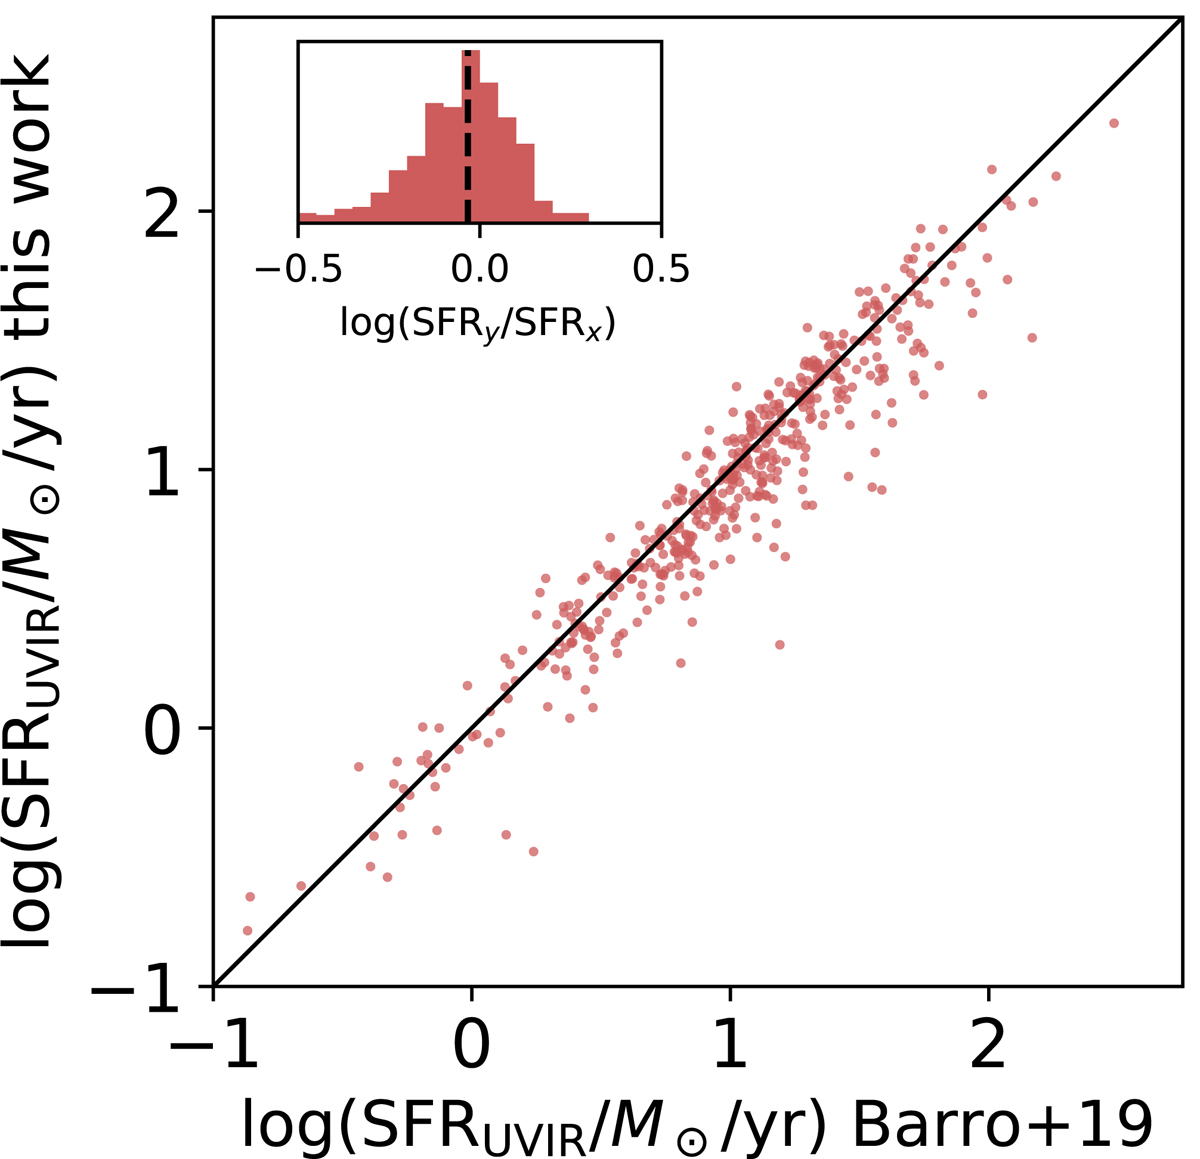
Comparison between two methods deriving SFR from rest-frame IR, both applied to 509 galaxies at z < 1.8 in the COSMOS-CANDELS area (red dots). The method used in the present work follows Ilbert et al. (2015) and is summarized in Sect. 3.2 (see Eq. 1). The SFRUVIR estimates on the y axis are described in Barro et al. (2019). A solid line shows the 1:1 relationship. The inset in the top-left corner shows a histogram of the difference between Barro et al. (labeled SFRy) and our estimates (SFRx), and a vertical dashed line that marks the median offset at −0.03 dex.
Current usage metrics show cumulative count of Article Views (full-text article views including HTML views, PDF and ePub downloads, according to the available data) and Abstracts Views on Vision4Press platform.
Data correspond to usage on the plateform after 2015. The current usage metrics is available 48-96 hours after online publication and is updated daily on week days.
Initial download of the metrics may take a while.