Fig. 15.
Download original image
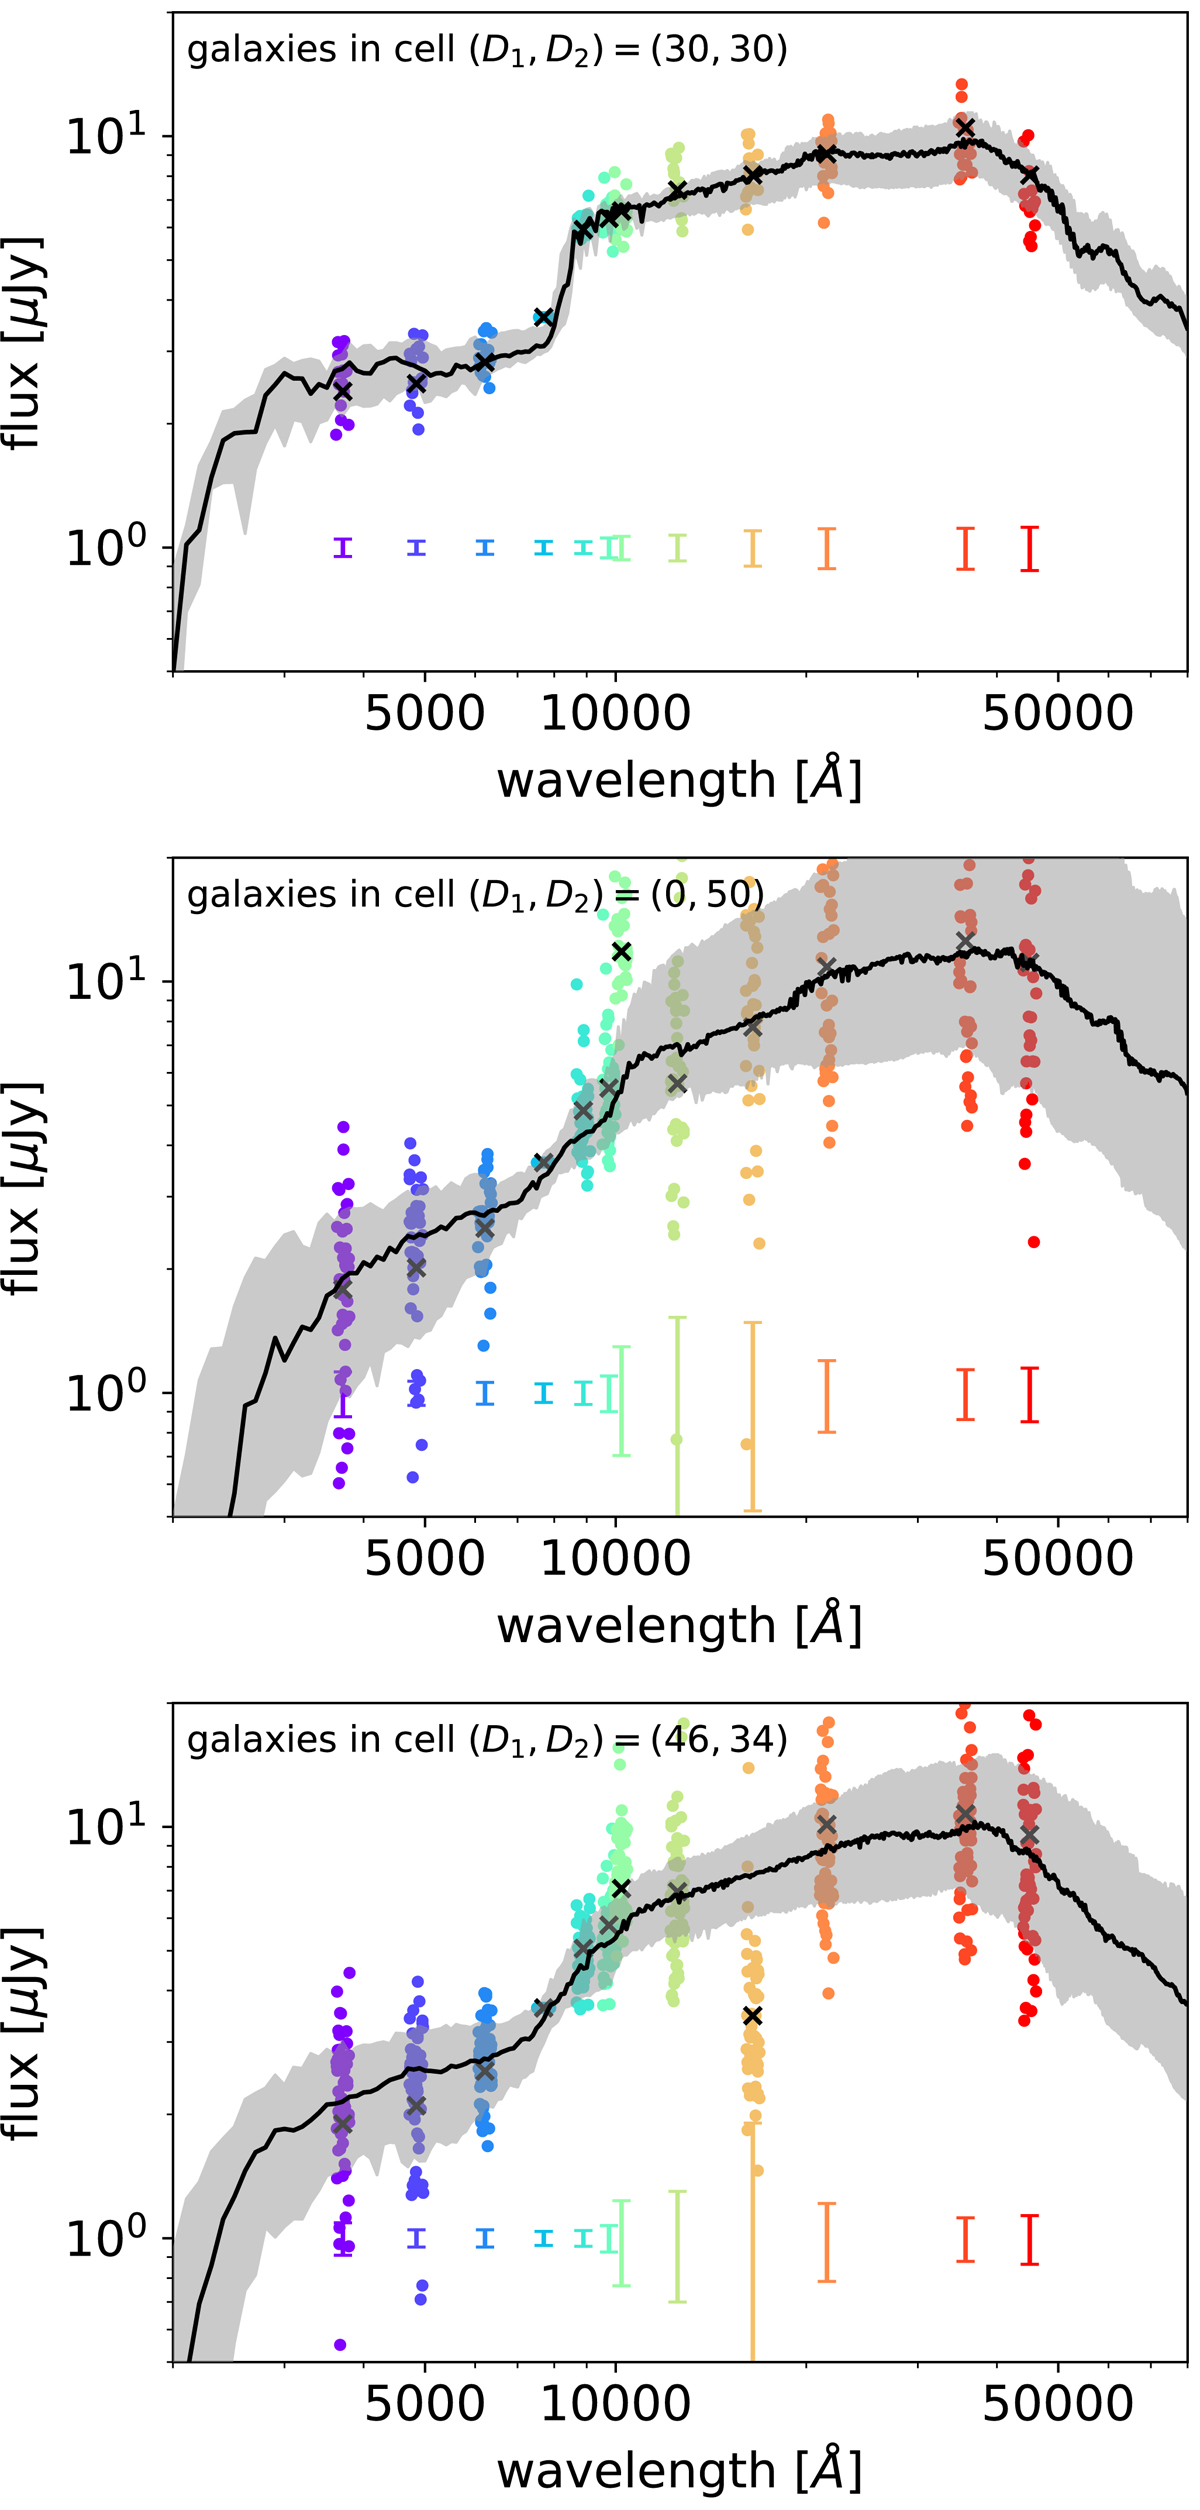
Inspection of three SOM cells with coordinates (D1, D2)=[(30, 30),(0, 50),(46, 34)] on the 80 × 80 gird. The first cell (upper panel) has been randomly selected among those with a small galaxy-weight distance Δ (cf. Fig. 2) while the middle and lower panels display two cells located in areas with large Δ values, to provide an insight on SOM shortcomings (see Sect. 5.4). The number of galaxies in these cells is respectively 16, 39, 56. In each panel, the solid line is the median of the BC03 spectral models providing the best fit to each COSMOS2020 galaxy in the LePhare analysis; before calculating the median, all the BC03 spectra (which include only the stellar component, not the nebular emission) have been rescaled to match 22.5 mag in the i band. Such a rescaling also makes easier to compare spectral shapes from the different panels. The gray shaded area encloses the 16th and 84th percentiles of their distribution. The y-axis range in the upper panel is shorter to zoom in the tight 16th–84th dispersion, which would be barely visible otherwise. Filled circles represent the observed photometry, color-coded for the different bands (see legend); for sake of clarity they have been horizontally shifted from the central wavelength of their band by a random offset within ±3%. In the bottom part of each panel we report the average error bars in the same color of their corresponding photometric band. Black crosses are the fluxes that would result from the cell’s weight after training. All symbols are renormalized to the reference i = 22.5 mag.
Current usage metrics show cumulative count of Article Views (full-text article views including HTML views, PDF and ePub downloads, according to the available data) and Abstracts Views on Vision4Press platform.
Data correspond to usage on the plateform after 2015. The current usage metrics is available 48-96 hours after online publication and is updated daily on week days.
Initial download of the metrics may take a while.