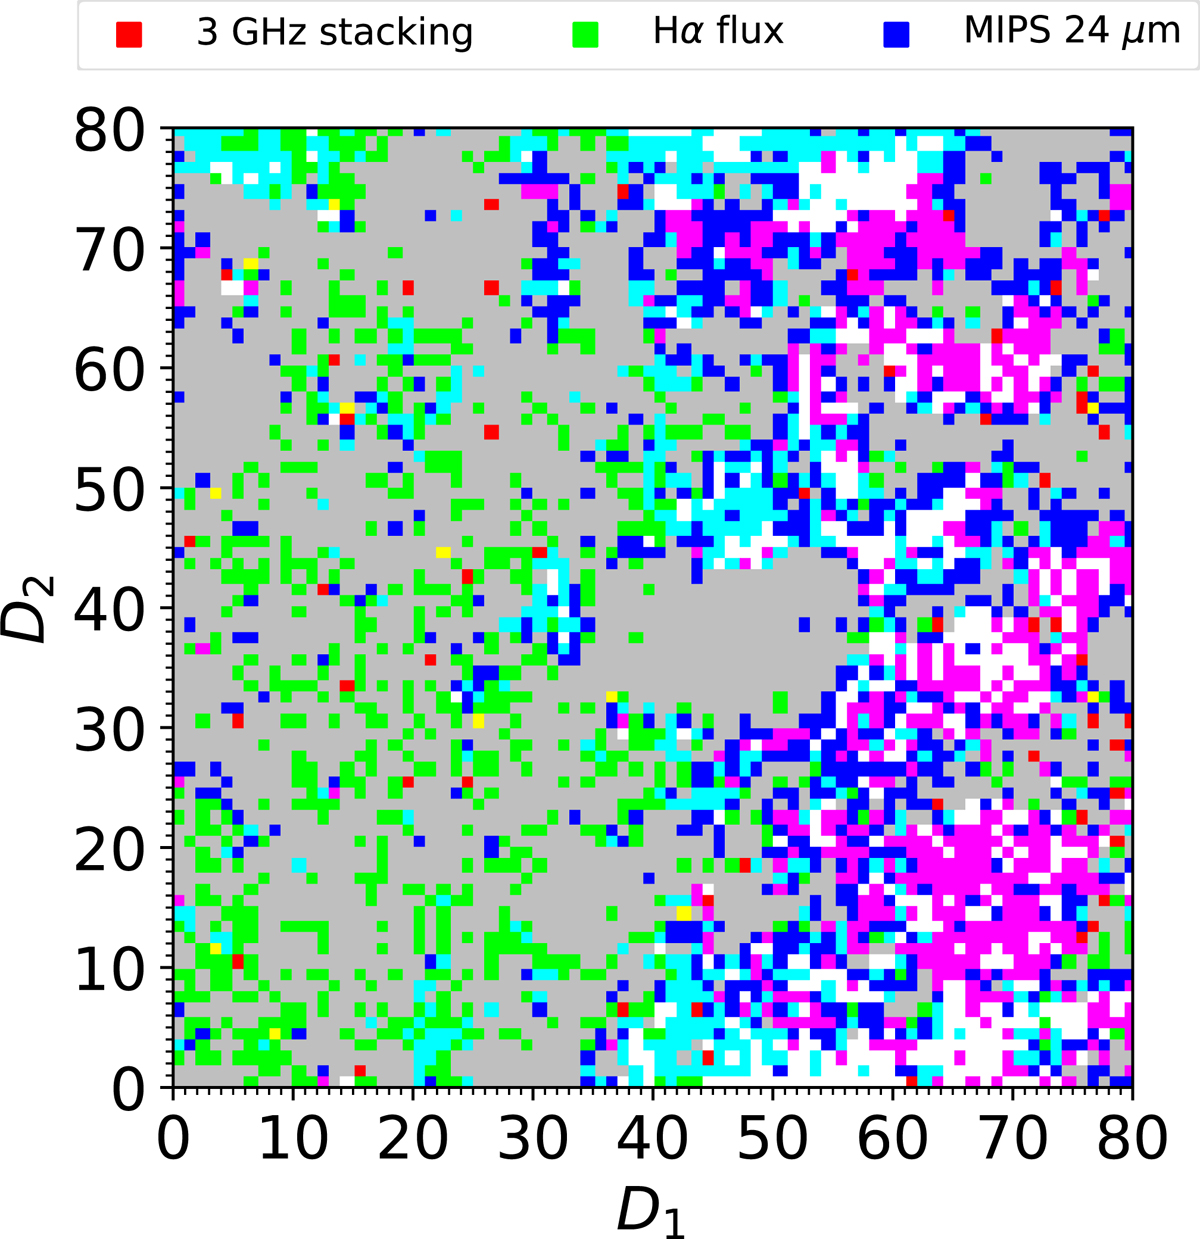
Fig. 14.
Download original image
Different calibration samples that may be used to label SFR on the SOM. Cells containing galaxies from the original MIPS sample (cf. Fig. 4) are colored in blue; cells containing spectroscopic galaxies with an Hα measurement and radio galaxies with a 3 GHz stacking S/N > 5 are colored in green and red respectively. Colors combine by following the standard RGB rules, e.g. a cell that can be calibrated by both MIPS and Hα (MIPS and radio) is colored in cyan (magenta). A handful of yellow pixels are cells that can be calibrated by only radio stacking and Hα, while white pixels are cells in which all the three star formation tracers are available. As the discussion in the main text is only about coverage and not the actual SFRlabel values, these are not shown in the present figure.
Current usage metrics show cumulative count of Article Views (full-text article views including HTML views, PDF and ePub downloads, according to the available data) and Abstracts Views on Vision4Press platform.
Data correspond to usage on the plateform after 2015. The current usage metrics is available 48-96 hours after online publication and is updated daily on week days.
Initial download of the metrics may take a while.