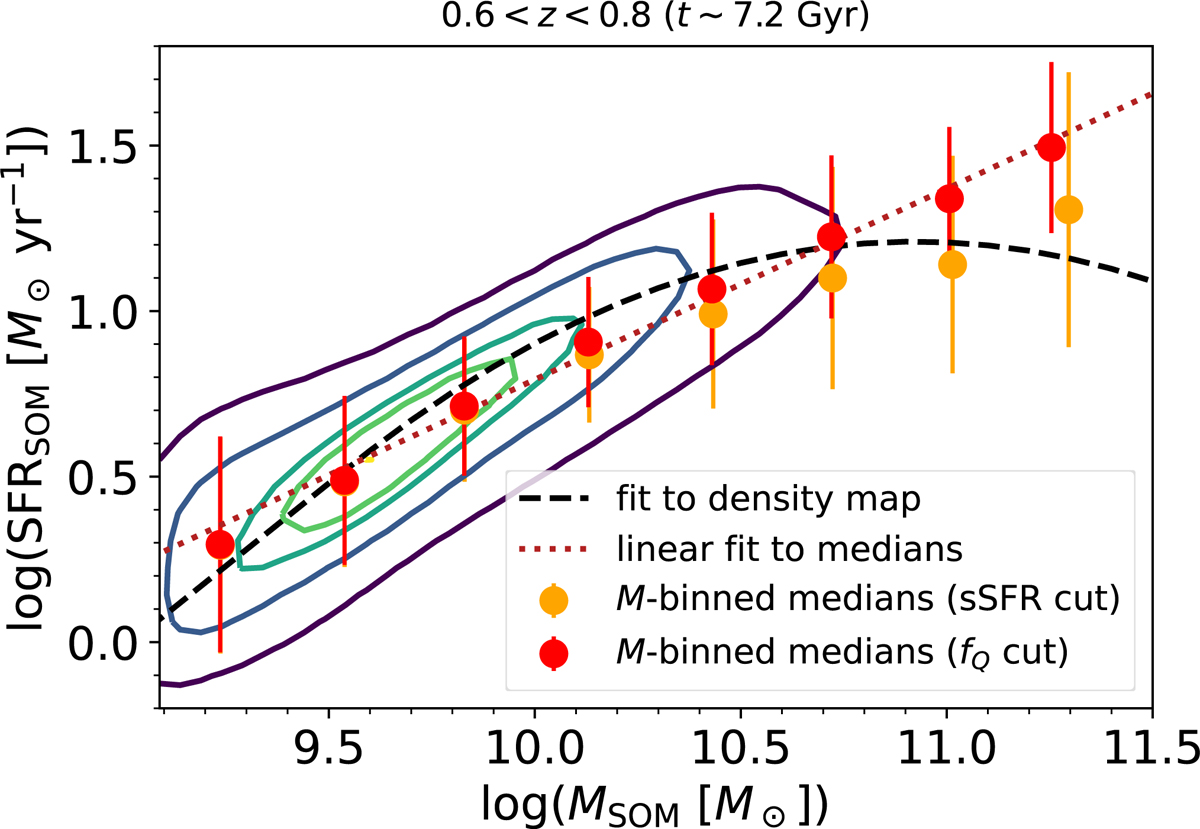
Fig. 13.
Download original image
Solid lines show the contour density map for the distribution of SXDF2018 galaxies in the SFR–M diagram; this is fit by Eq. (8) as described in Sect. 4.3 (dashed line). Filled circles are SFR median in running bins of galaxies with SFRSOM/MSOM > 10−11 yr−1 (orange symbols) and fQ < 0.5 (red). In both cases, error bars are calculated with the 16th–84th percentile difference. The red circles are interpolated by a linear function (dotted line).
Current usage metrics show cumulative count of Article Views (full-text article views including HTML views, PDF and ePub downloads, according to the available data) and Abstracts Views on Vision4Press platform.
Data correspond to usage on the plateform after 2015. The current usage metrics is available 48-96 hours after online publication and is updated daily on week days.
Initial download of the metrics may take a while.