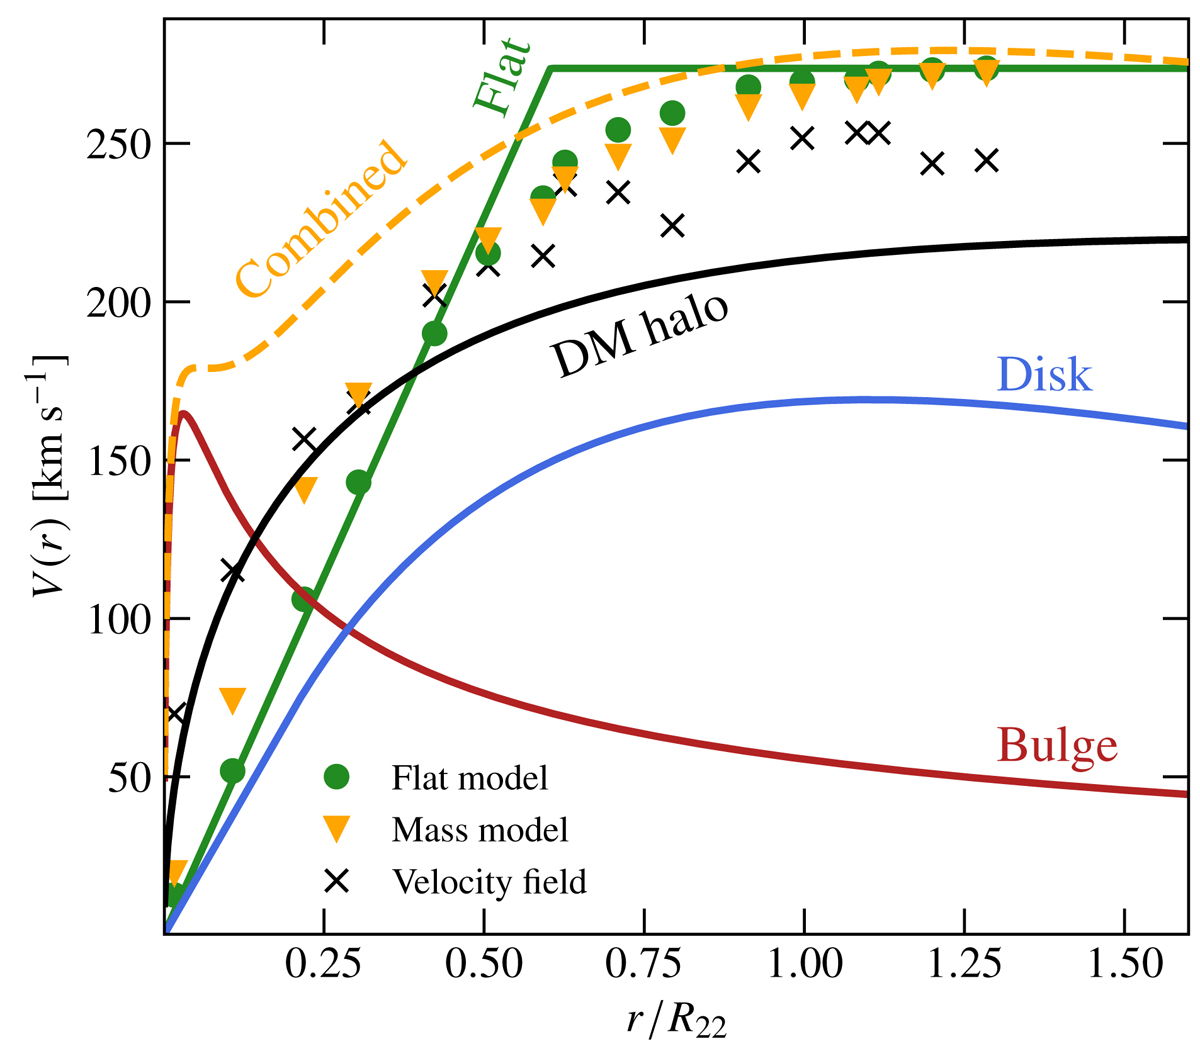
Fig. 7.
Download original image
Rotation curves for the flat (green line) and mass models (orange dashed) of galaxy 104-CGR79 at redshift z = 0.53. The components are the bulge (red), the thin disk (blue), and the DM halo (black). We also show the observed de-projected (but beam-smeared) rotation curves extracted along the major axis from the observed velocity field map (black crosses), from the best-fit velocity field flat model (green circles), and from the best-fit velocity field mass model (orange triangles). The largest difference between the flat and mass models is found in the inner parts, where the beam smearing is the strongest. The total dynamical mass differs slightly between models, with the flat one being 4% higher than the mass model one.
Current usage metrics show cumulative count of Article Views (full-text article views including HTML views, PDF and ePub downloads, according to the available data) and Abstracts Views on Vision4Press platform.
Data correspond to usage on the plateform after 2015. The current usage metrics is available 48-96 hours after online publication and is updated daily on week days.
Initial download of the metrics may take a while.