Fig. 6.
Download original image
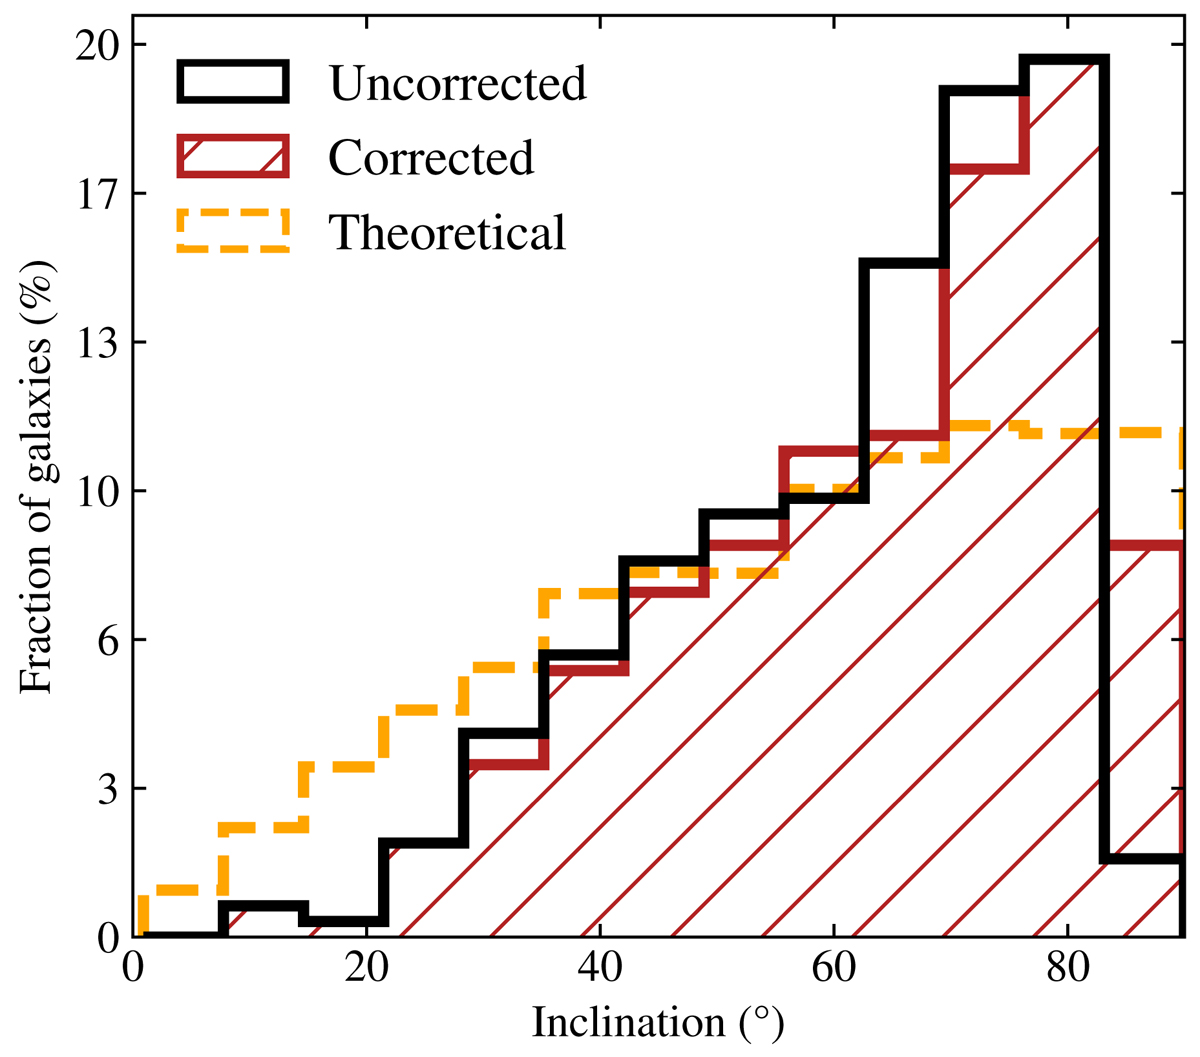
Distribution of disk inclination for galaxies from the morphological sample, after removing bulge-dominated galaxies and those with small disk sizes. We show the distribution before correcting for the finite thickness of the disk (black line) and after the correction (red hatched area). The dashed orange line represents the binned theoretical distribution expected for randomly oriented disk galaxies. The correction tends to increase the fraction of edge-on galaxies. While being closer to the theoretical distribution at large inclinations, the corrected inclinations still do not match the distribution of randomly inclined galaxies.
Current usage metrics show cumulative count of Article Views (full-text article views including HTML views, PDF and ePub downloads, according to the available data) and Abstracts Views on Vision4Press platform.
Data correspond to usage on the plateform after 2015. The current usage metrics is available 48-96 hours after online publication and is updated daily on week days.
Initial download of the metrics may take a while.