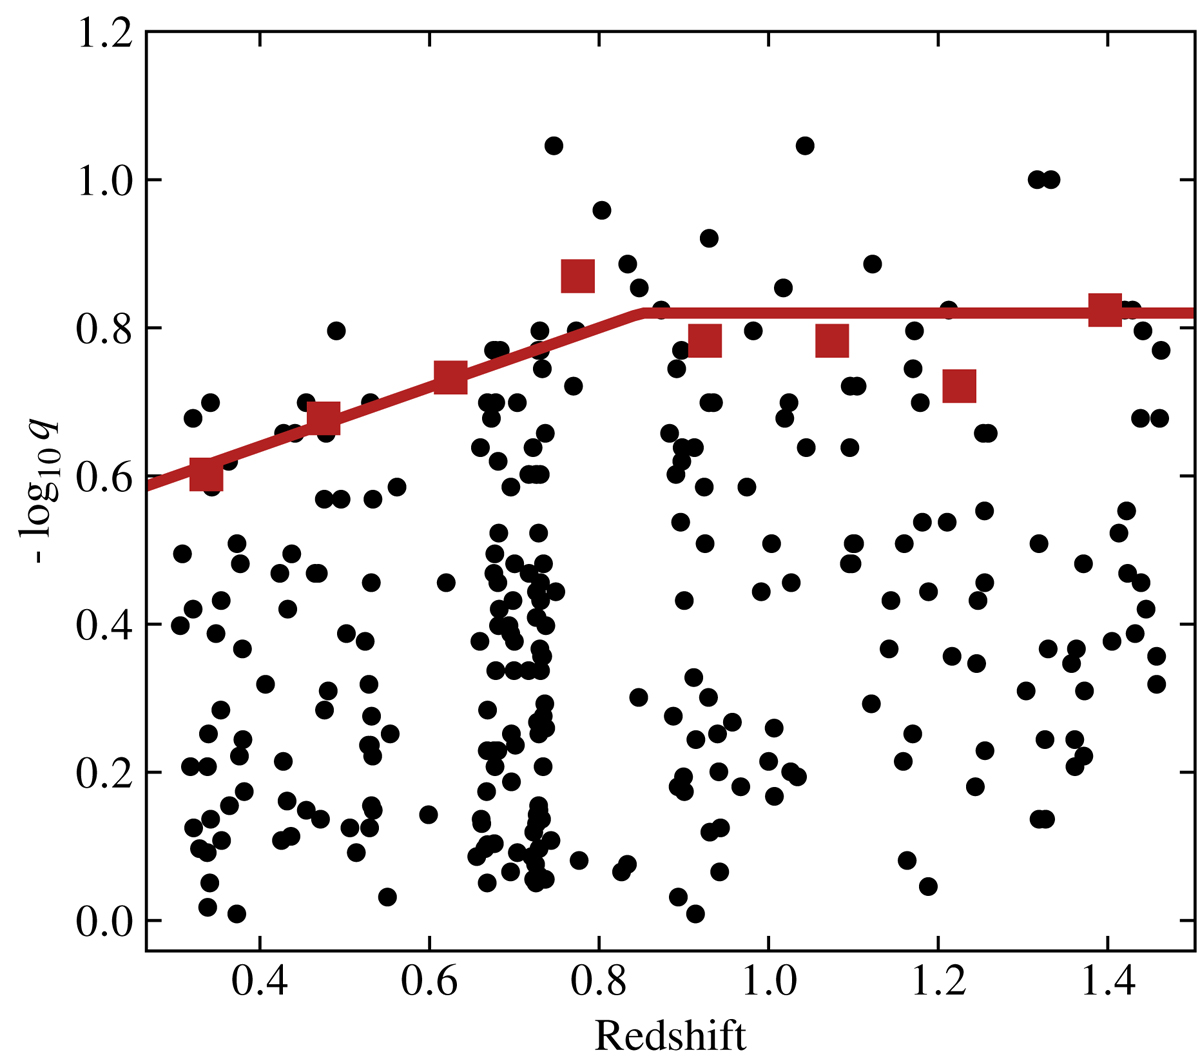
Fig. 5.
Download original image
Observed axis ratio, q, as a function of redshift for galaxies from the morphological sample (black points) after removing bulge-dominated galaxies and those with small disk sizes. The median values for the six most edge-on galaxies in redshift bins of width Δz = 0.15 are shown as red squares. The red line represents the thickness prescription that was applied. Independently of mass, galaxies tend to have thinner disks at larger redshifts, which may be due to the fact that we probe younger stellar populations at higher redshifts when observing in a single band.
Current usage metrics show cumulative count of Article Views (full-text article views including HTML views, PDF and ePub downloads, according to the available data) and Abstracts Views on Vision4Press platform.
Data correspond to usage on the plateform after 2015. The current usage metrics is available 48-96 hours after online publication and is updated daily on week days.
Initial download of the metrics may take a while.