Fig. 3.
Download original image
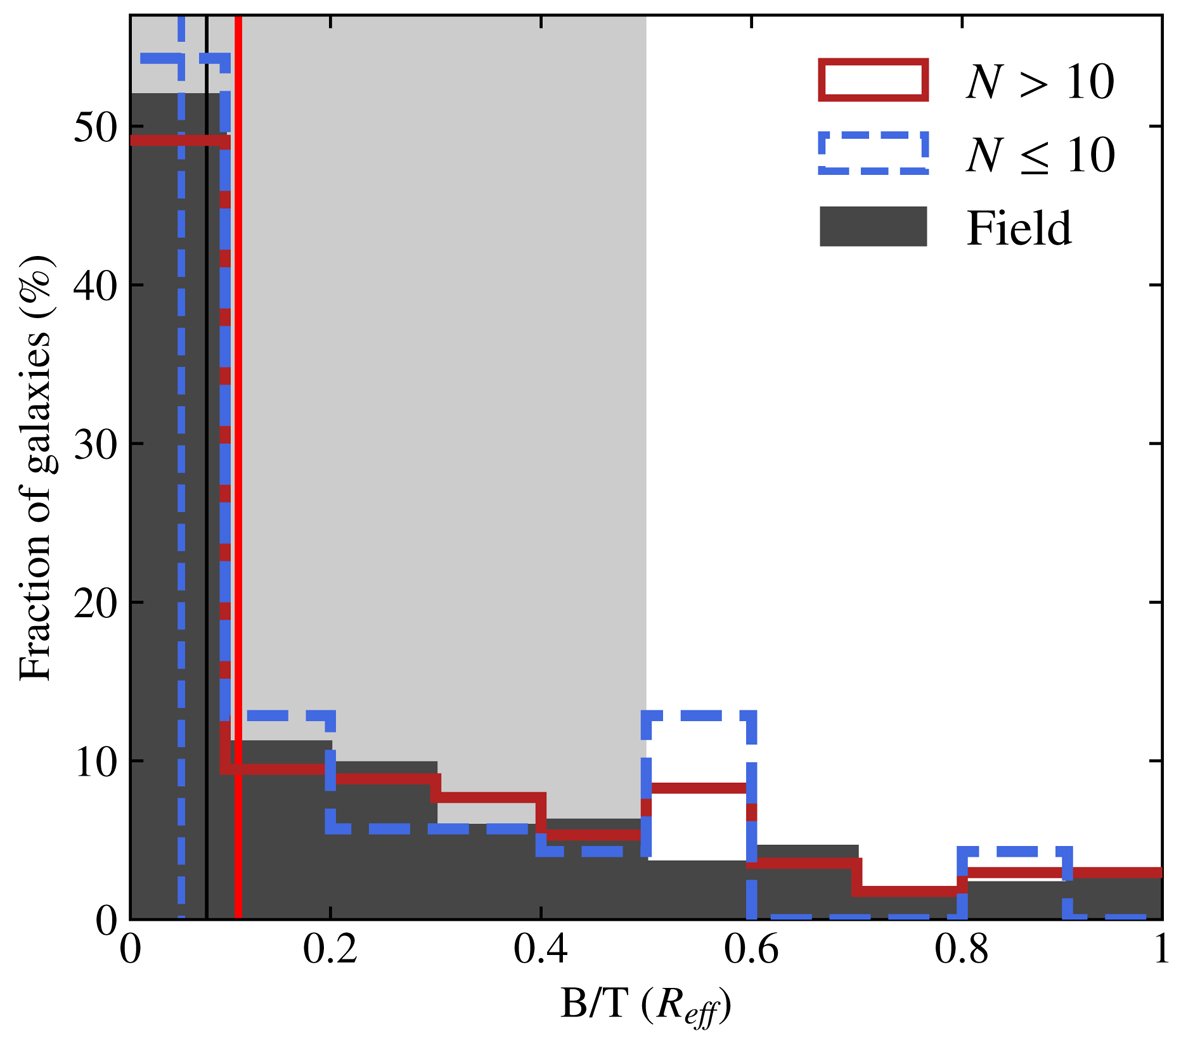
Bulge-to-total flux ratio distribution computed at one effective radius for galaxies in the morphological sample located in various environments. The legend is similar to that of Fig. 1. The vertical lines correspond to the median B/T values for each sample. The grey area in the background indicates which galaxies were selected in the kinematics sample (see Sect. 5.1).
Current usage metrics show cumulative count of Article Views (full-text article views including HTML views, PDF and ePub downloads, according to the available data) and Abstracts Views on Vision4Press platform.
Data correspond to usage on the plateform after 2015. The current usage metrics is available 48-96 hours after online publication and is updated daily on week days.
Initial download of the metrics may take a while.