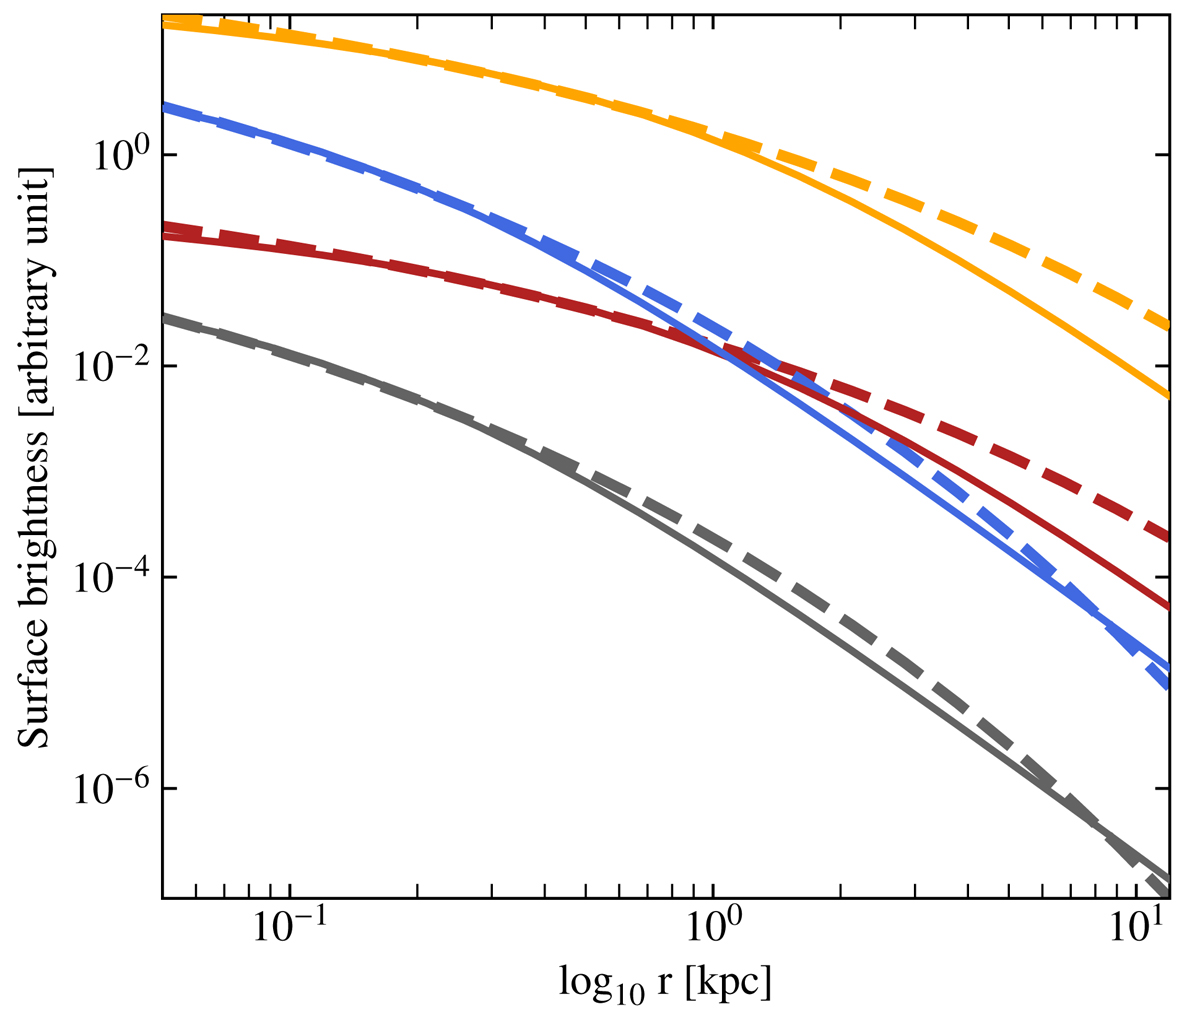
Fig. D.5.
Download original image
Examples of de Vaucouleurs profiles (dashed lines) and their corresponding sky projected Hernquist profiles (continuous lines) using the scaling relations in Eqs. D.28 and D.29. From top to bottom, the Sérsic parameters are (Σeff, Reff)=(10−3, 0.5) (orange), (10−3, 6) (blue), (0.1, 0.5) (red), and (0.1, 6) (grey). Because the deviation of the projected Hernquist profile to the Sérsic one occurs mainly at large distances, where the surface brightness quickly drops, the overall fluxes are actually in quite good agreement.
Current usage metrics show cumulative count of Article Views (full-text article views including HTML views, PDF and ePub downloads, according to the available data) and Abstracts Views on Vision4Press platform.
Data correspond to usage on the plateform after 2015. The current usage metrics is available 48-96 hours after online publication and is updated daily on week days.
Initial download of the metrics may take a while.