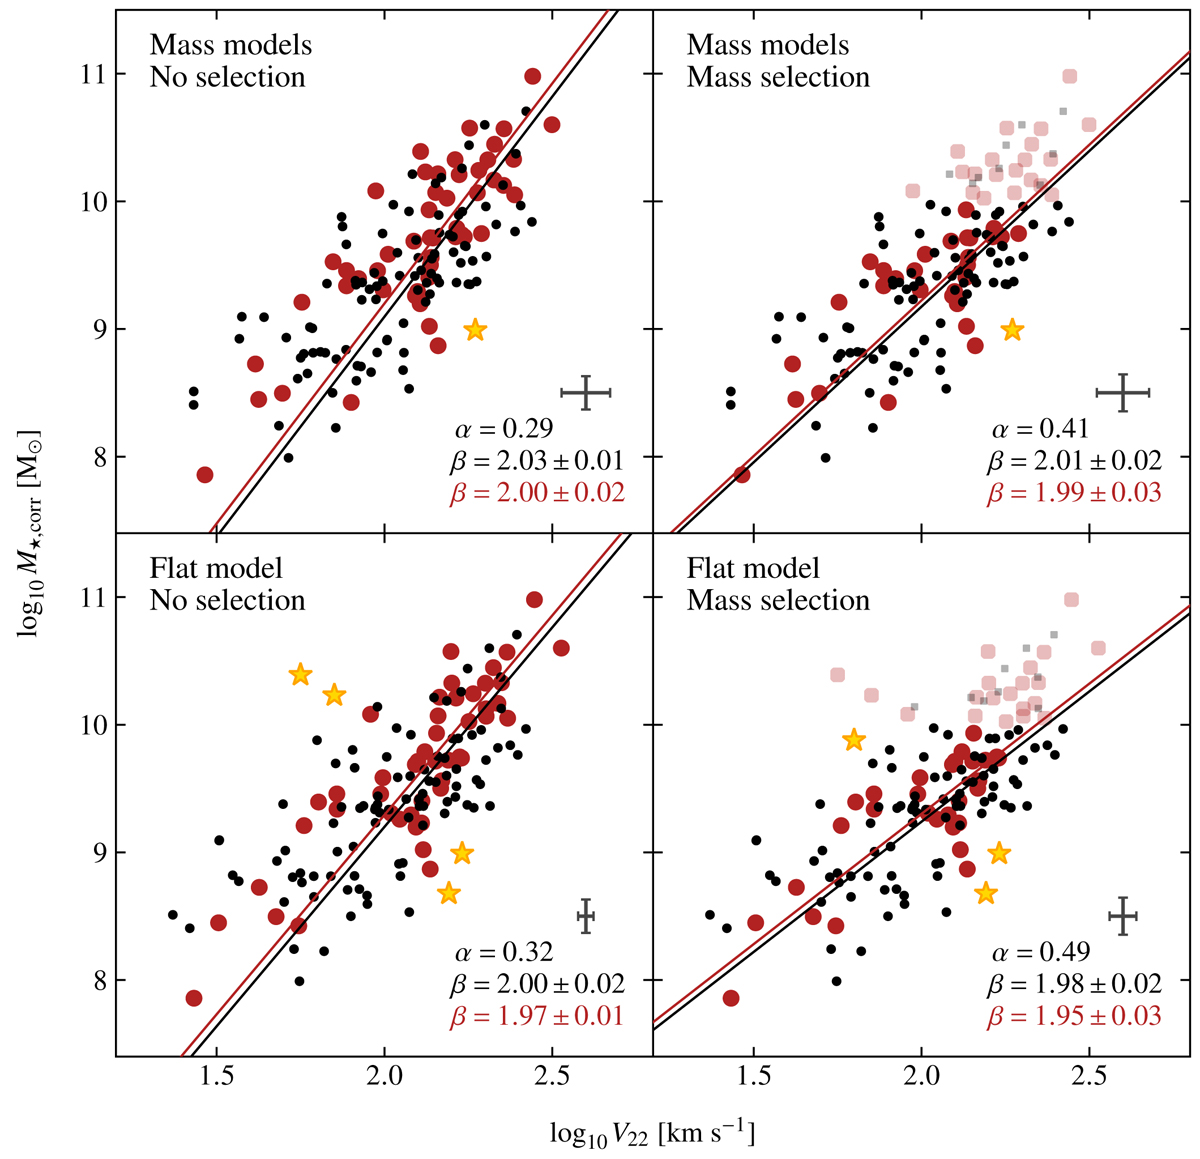
Fig. B.3.
Download original image
TFR with and without applying the mass selection criterion (vi) on galaxies from the TFR sample. The data points and best-fit lines are similar to Fig. 13. The first row shows the TFR using the velocity derived from the best-fit mass models, and the second row the TFR using the flat model. As an indication, we also show as semi-transparent symbols galaxies removed by the mass cut in the rightmost panels. The typical uncertainty on stellar mass and velocity is shown on each panel as a grey error bar.
Current usage metrics show cumulative count of Article Views (full-text article views including HTML views, PDF and ePub downloads, according to the available data) and Abstracts Views on Vision4Press platform.
Data correspond to usage on the plateform after 2015. The current usage metrics is available 48-96 hours after online publication and is updated daily on week days.
Initial download of the metrics may take a while.