Fig. 2.
Download original image
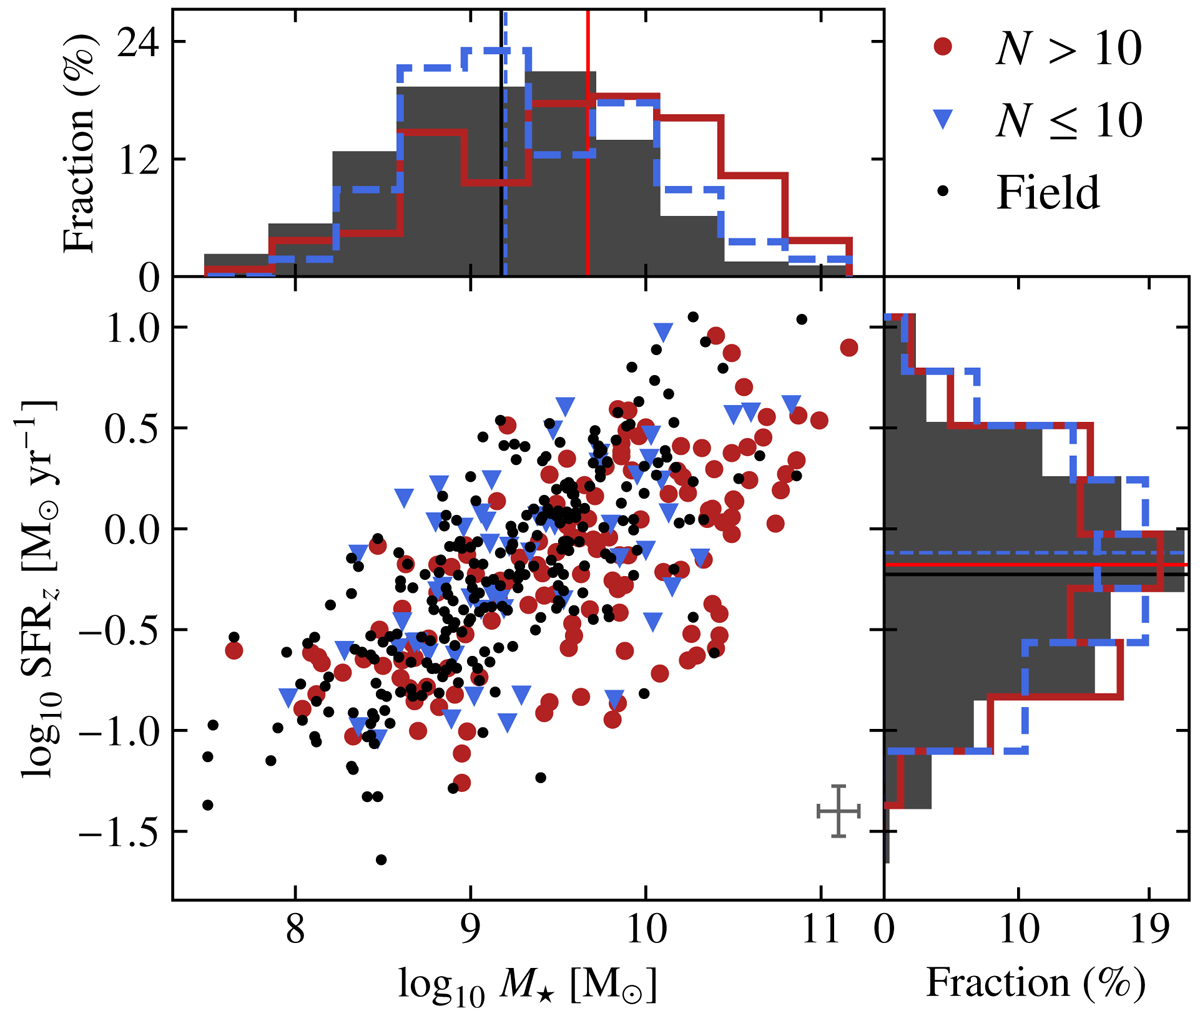
SFR-M⋆ diagram for galaxies from the kinematics sample (see Sect. 6.1). Galaxies are separated between the field (black points), small structures (blue triangles), and large structures (red circles). The typical stellar mass and SFR error is shown on the bottom right. The SFR was normalised to redshift z0 = 0.7. The SFR and mass distributions are shown as histograms to the top and right, respectively, with the median values for each sample represented as lines of similar colours.
Current usage metrics show cumulative count of Article Views (full-text article views including HTML views, PDF and ePub downloads, according to the available data) and Abstracts Views on Vision4Press platform.
Data correspond to usage on the plateform after 2015. The current usage metrics is available 48-96 hours after online publication and is updated daily on week days.
Initial download of the metrics may take a while.