Fig. A.3.
Download original image
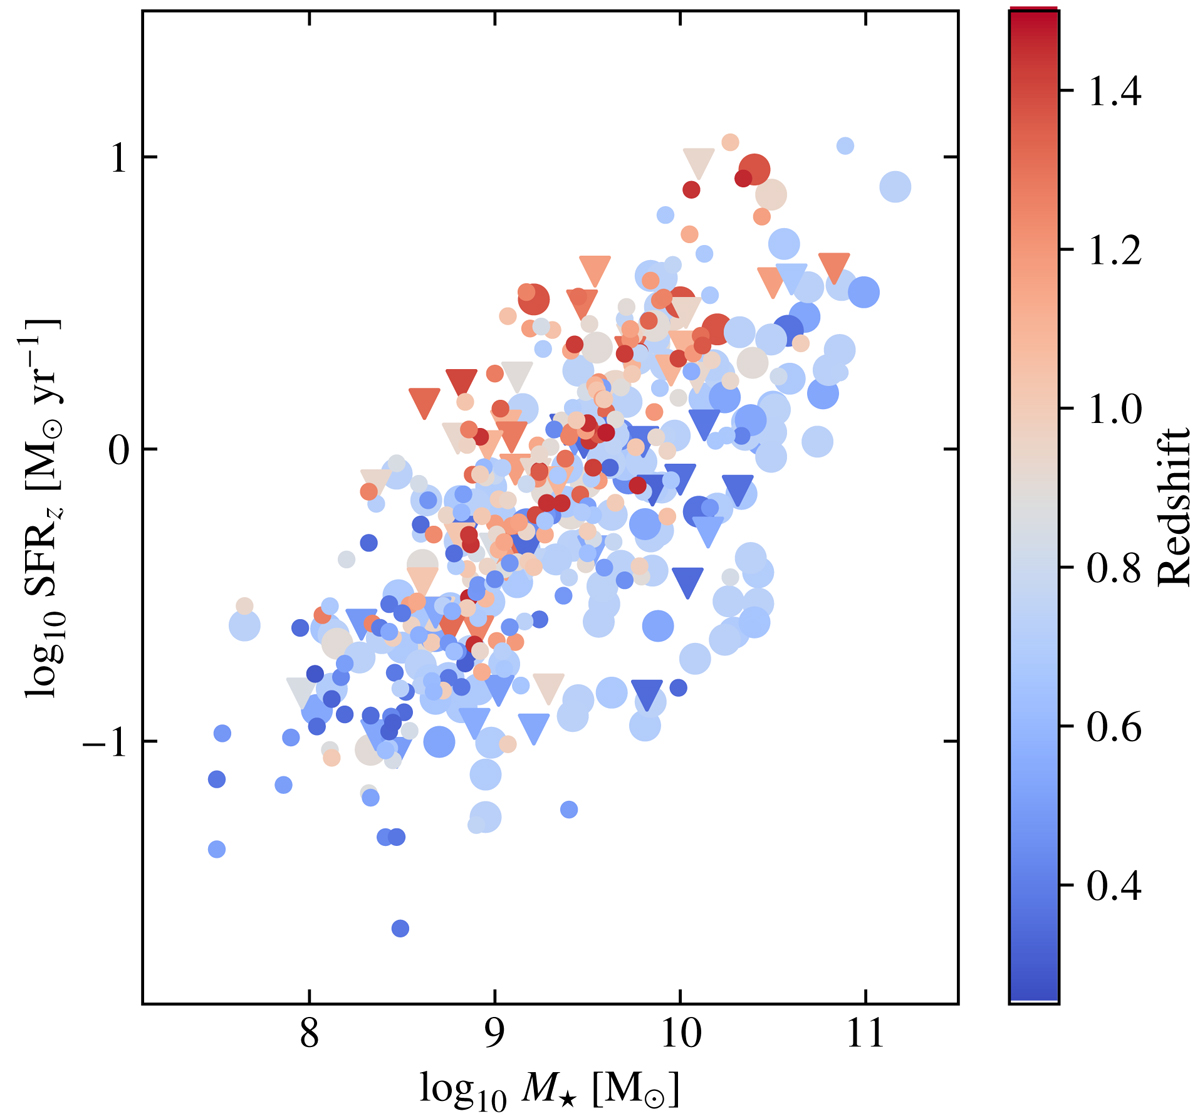
SFR-stellar mass relation for galaxies from the MS sample, colour-coded as a function of redshift. Despite the applied normalisation to redshift z0 = 0.7, we still see a dichotomy. High redshift galaxies tend to align along lines with the largest specific star formation rate (sSFR), while low redshift galaxies tend to align along lines with the lowest sSFR because of the survey design.
Current usage metrics show cumulative count of Article Views (full-text article views including HTML views, PDF and ePub downloads, according to the available data) and Abstracts Views on Vision4Press platform.
Data correspond to usage on the plateform after 2015. The current usage metrics is available 48-96 hours after online publication and is updated daily on week days.
Initial download of the metrics may take a while.