Fig. 13.
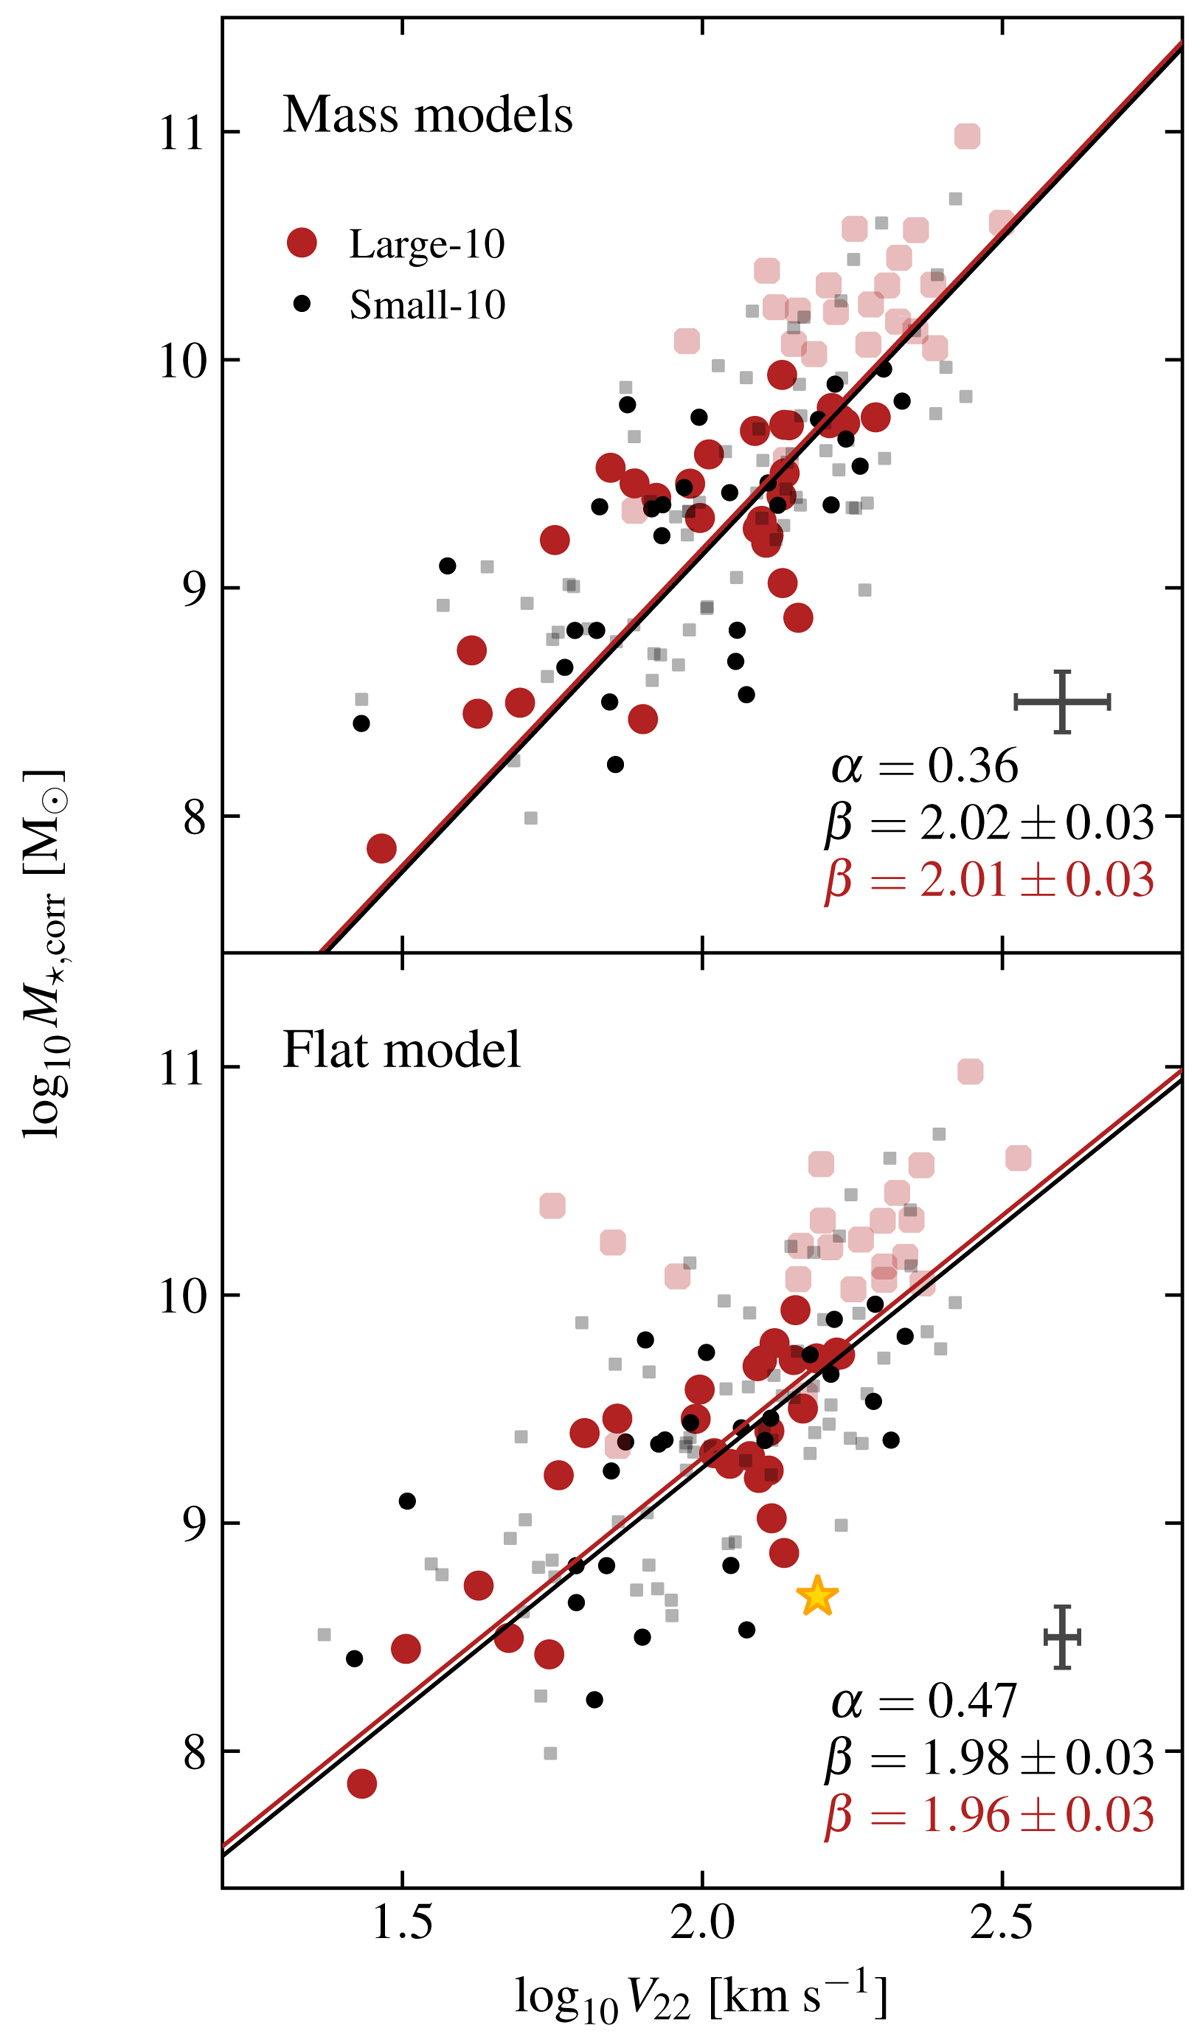
Download original image
Stellar mass TFR at R22 for galaxies from the TFR sample with mass and redshift cuts applied (vi and vii). The top panel shows the TFR using the velocity computed from the mass models, and the bottom shows the TFR using the velocity from a flat model. Galaxies are split between field and small structure (black points) and large structure (red circles) sub-samples using a richness threshold of N = 10. Orange stars represent galaxies identified as outliers from the fit done with LTSFIT. As an indication, we also show as semi-transparent symbols galaxies removed by the mass and redshift cuts. Best-fit linear relations for both sub-samples are shown as full lines. We provide in the bottom part of each panel the slope and best-fit zero points (see Eq. (12) with y = V22 and x = M⋆,corr). The typical uncertainty on stellar mass and velocity is shown as a grey error bar. After controlling for differences in mass and redshift, we do not find any impact of the environment on the zero point of either TFR.
Current usage metrics show cumulative count of Article Views (full-text article views including HTML views, PDF and ePub downloads, according to the available data) and Abstracts Views on Vision4Press platform.
Data correspond to usage on the plateform after 2015. The current usage metrics is available 48-96 hours after online publication and is updated daily on week days.
Initial download of the metrics may take a while.