Fig. 12.
Download original image
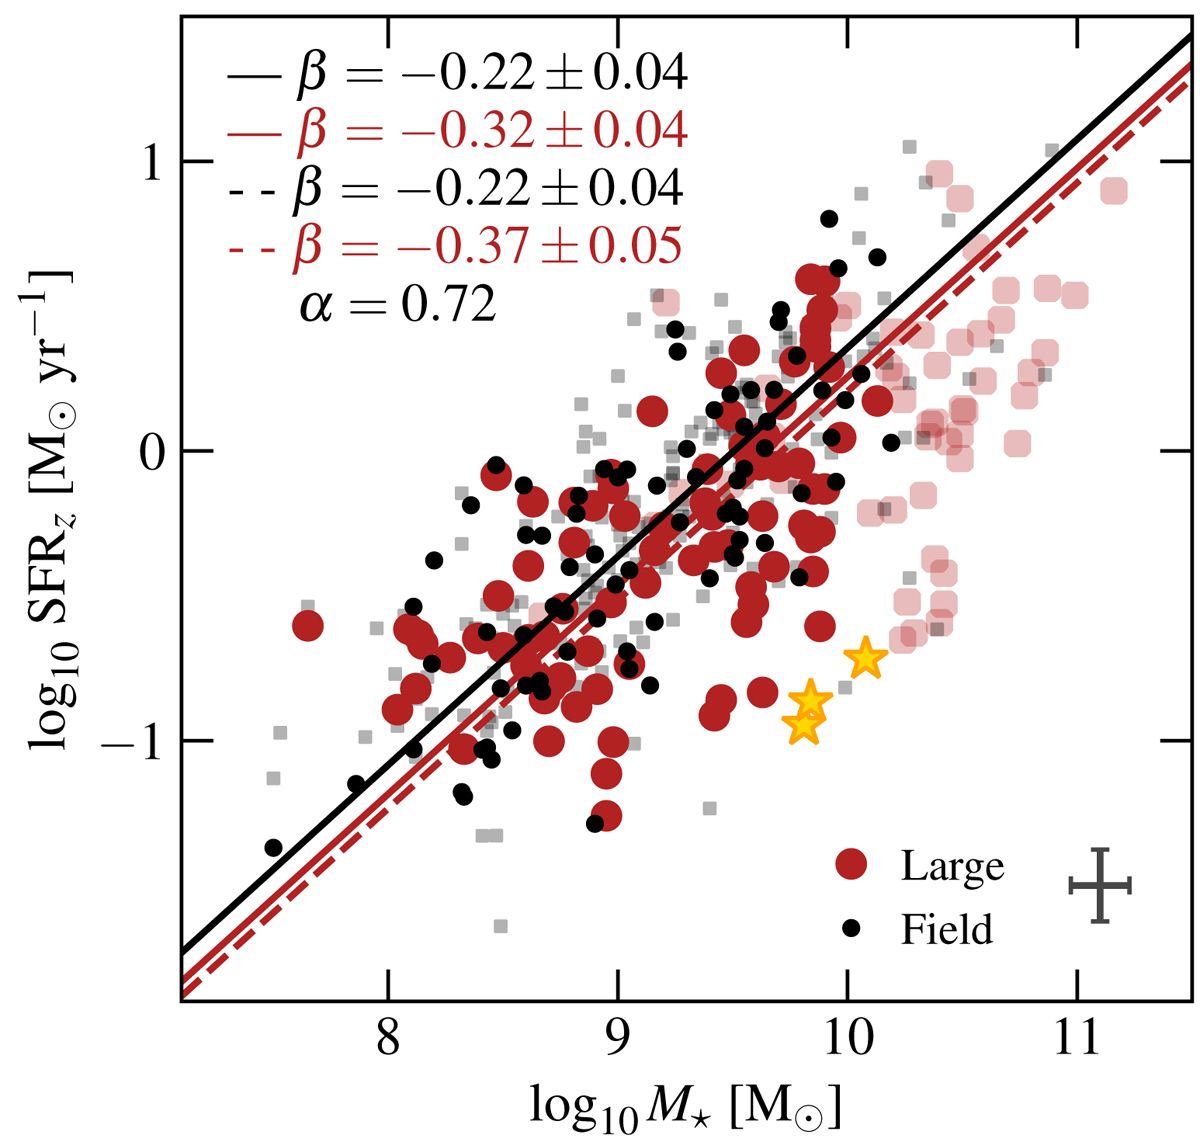
SFR-stellar mass relation for galaxies from the MS sample with additional mass and redshift cuts applied (vi and vii). Symbols and colours are similar to those in Fig. 2, and orange stars represent galaxies identified as outliers from the fit done with LTSFIT. As an indication, we also show as semi-transparent symbols galaxies removed by the mass and redshift cuts. Best-fit lines are shown when using a richness threshold N = 10 (full lines) and N = 20 (dashed lines). We do not show galaxies in the small structure sub-sample since too few galaxies remain after selection criteria (vi) and (vii) are applied. The SFR is normalised to redshift z0 = 0.7 (see Sect. 3.3). We also provide the slope and best-fit zero point for each sub-sample in the top left (see Eq. (12) with y = SFR and x = M⋆). The typical uncertainty on stellar mass and SFR is shown in the bottom right as a grey error bar. Even after controlling for differences in mass and redshift, we find a 2σ significant difference of 0.10 dex between sub-samples with N = 10, and a 3σ significant difference of 0.15 dex with N = 20.
Current usage metrics show cumulative count of Article Views (full-text article views including HTML views, PDF and ePub downloads, according to the available data) and Abstracts Views on Vision4Press platform.
Data correspond to usage on the plateform after 2015. The current usage metrics is available 48-96 hours after online publication and is updated daily on week days.
Initial download of the metrics may take a while.