Fig. 1.
Download original image
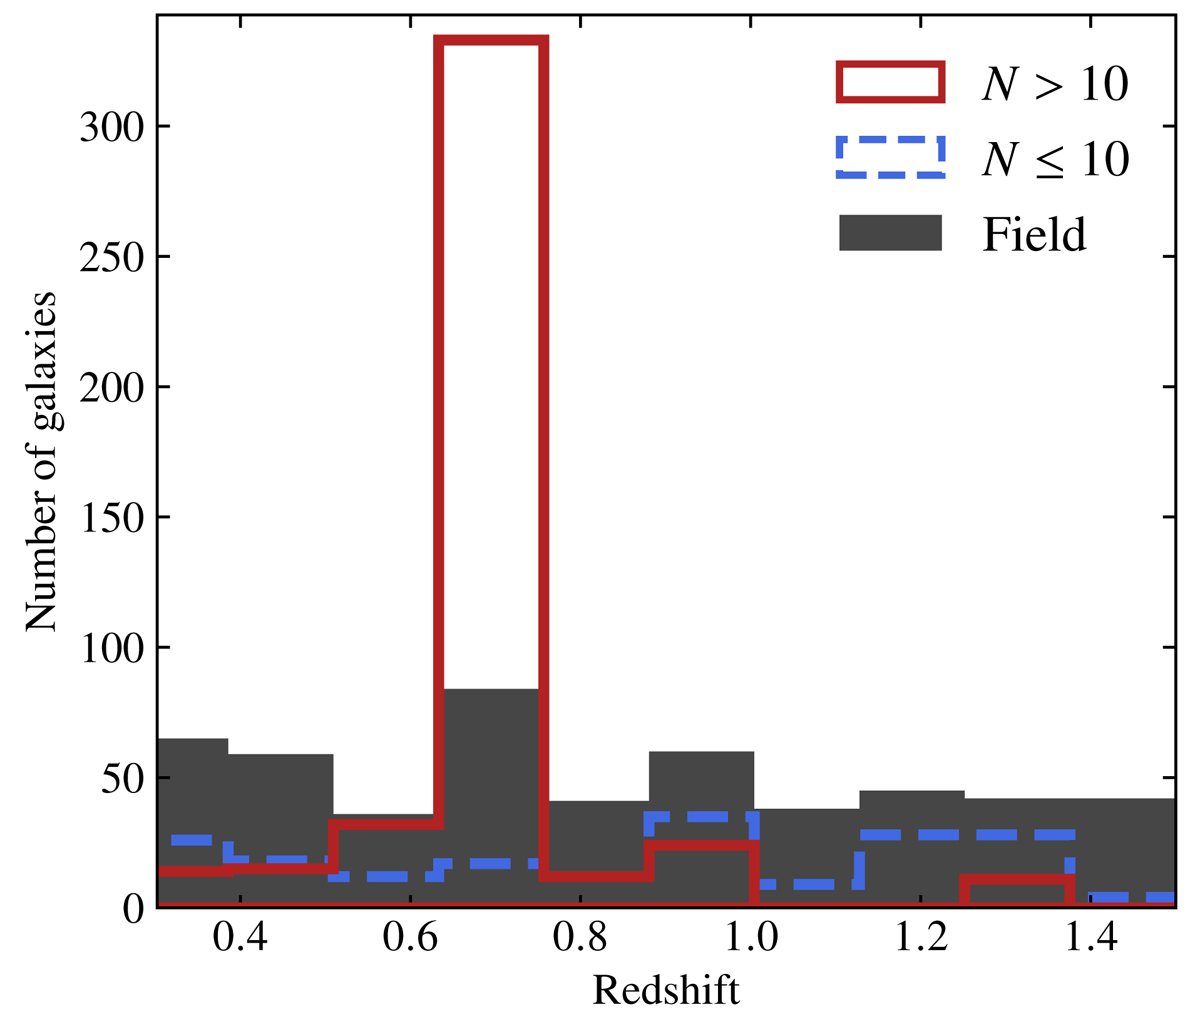
Redshift distribution for the three initial sub-samples defined in Sect. 3.2. The samples of field galaxies (grey area) and galaxies in small structures (dashed blue line) have relatively flat distributions. The peak of the distribution for galaxies in large structures (red line) is located at redshift z ∼ 0.7 and is driven by the largest structures (40 ≲ N ≲ 100) found in the COSMOS area of the MAGIC sample.
Current usage metrics show cumulative count of Article Views (full-text article views including HTML views, PDF and ePub downloads, according to the available data) and Abstracts Views on Vision4Press platform.
Data correspond to usage on the plateform after 2015. The current usage metrics is available 48-96 hours after online publication and is updated daily on week days.
Initial download of the metrics may take a while.