Open Access
Fig. 9
Download original image
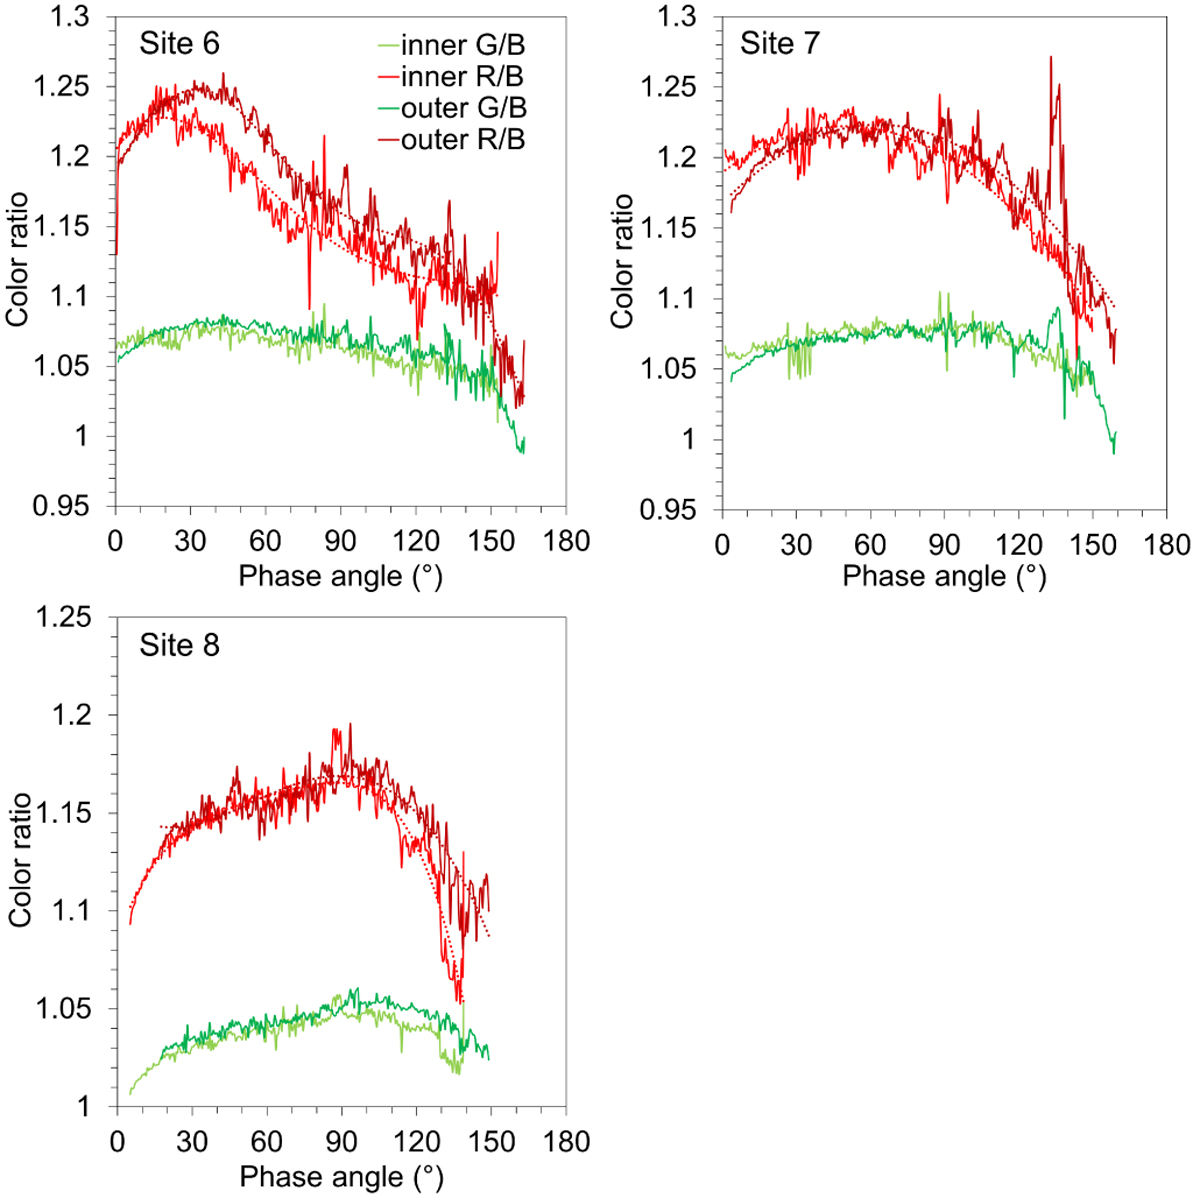
Phase ratios of the averaged phase curves versus phase angle for the three sites. R/B indicates the red channel divided by the blue channel, and G/B indicates the green channel divided by the blue channel. The dotted lines indicate the polynomial fitting results.
Current usage metrics show cumulative count of Article Views (full-text article views including HTML views, PDF and ePub downloads, according to the available data) and Abstracts Views on Vision4Press platform.
Data correspond to usage on the plateform after 2015. The current usage metrics is available 48-96 hours after online publication and is updated daily on week days.
Initial download of the metrics may take a while.