Open Access
Fig. 8
Download original image
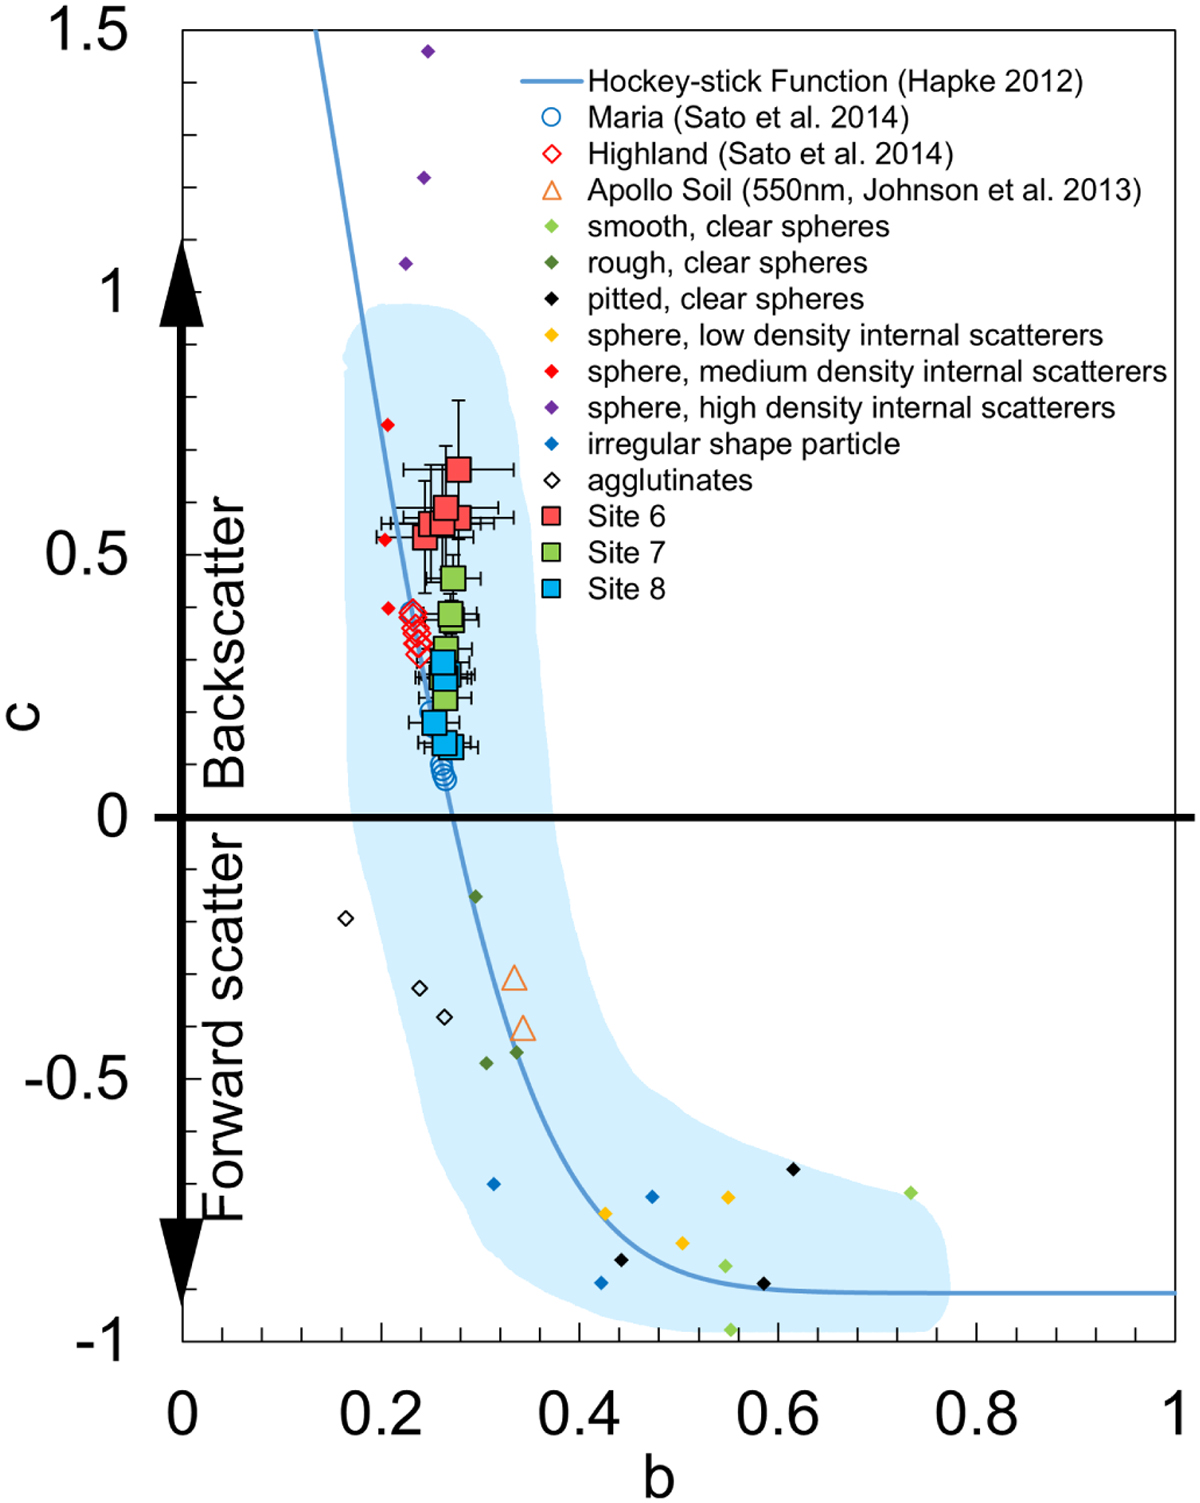
Plot of Henyey-Greenstein phase function parameters b and c. The blue curve is the hockey stick relation from Hapke (2012a). The artificial particle experimental data represented by small diamond marks and the blue reverse “J”-shaped region are from McGuire & Hapke (1995).
Current usage metrics show cumulative count of Article Views (full-text article views including HTML views, PDF and ePub downloads, according to the available data) and Abstracts Views on Vision4Press platform.
Data correspond to usage on the plateform after 2015. The current usage metrics is available 48-96 hours after online publication and is updated daily on week days.
Initial download of the metrics may take a while.