Fig. 4
Download original image
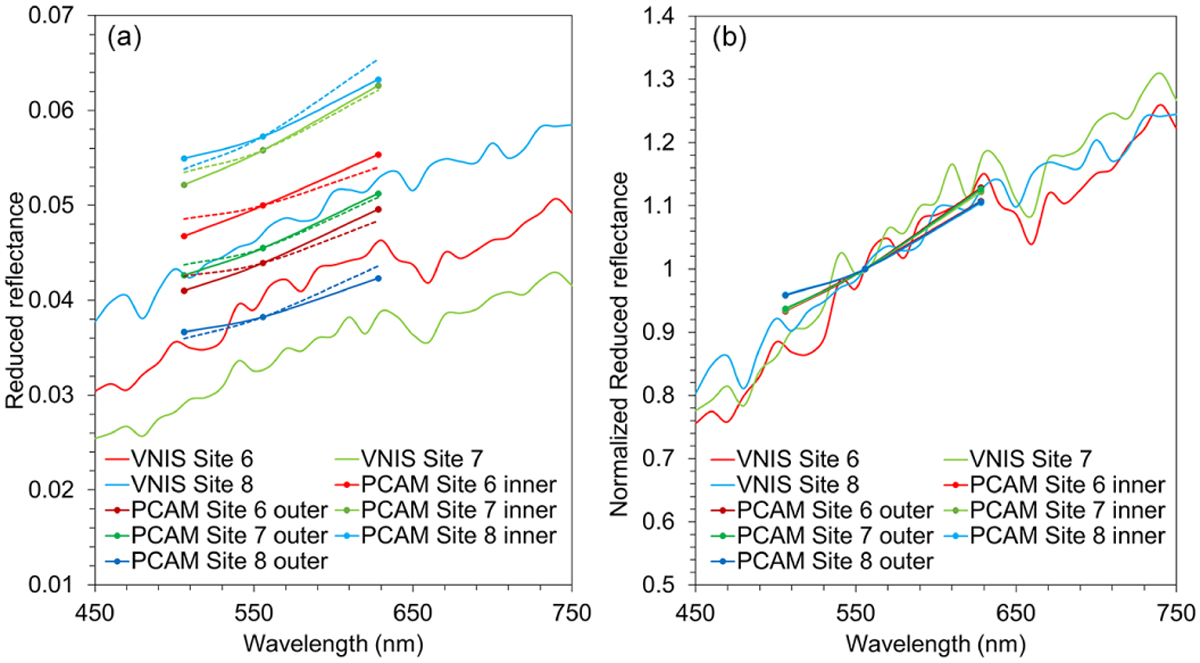
PCAM spectra before and after spectral correction compared with VNIS spectra. The lines with markers are the PCAM spectra after correction, the dashed lines in (a) are the PCAM spectra before correction, and the lines without markers are the VNIS spectra. (a) Original spectra. (b) Spectra normalized at 555 nm for VNIS and 555.7 nm fo PCAM.
Current usage metrics show cumulative count of Article Views (full-text article views including HTML views, PDF and ePub downloads, according to the available data) and Abstracts Views on Vision4Press platform.
Data correspond to usage on the plateform after 2015. The current usage metrics is available 48-96 hours after online publication and is updated daily on week days.
Initial download of the metrics may take a while.