Fig. 3
Download original image
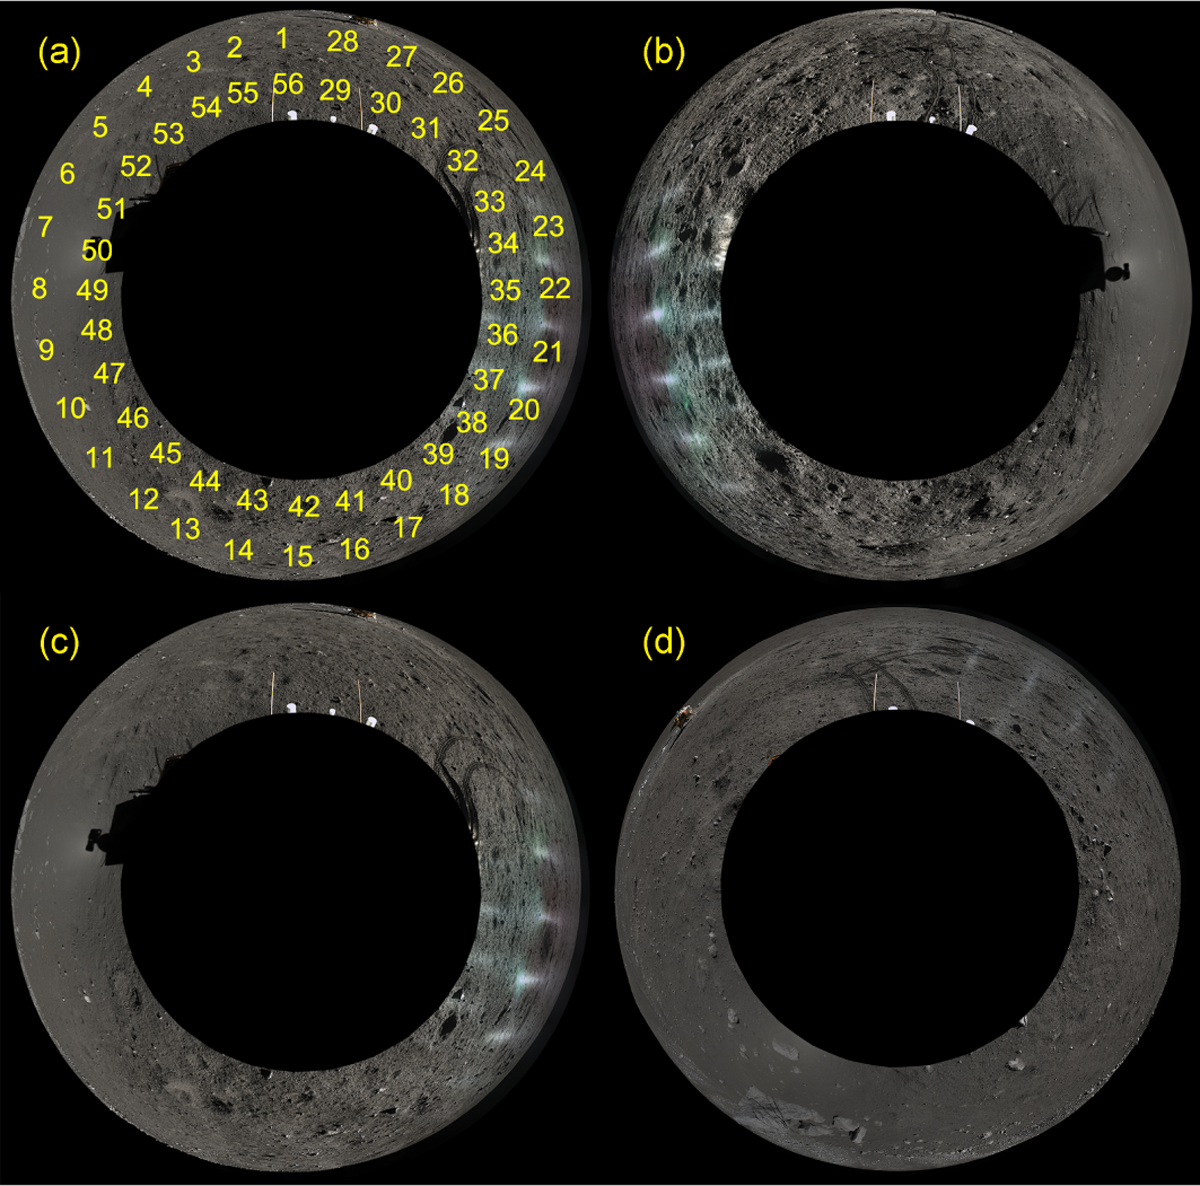
Mosaic of PCAM images in a ring, including the inner and outer rings. (a) Site 7. The red numbers denote the locations of the images labeled from 1 to 56. The locations are the same among the three mosaics. (b) Site 6. The shadow of the PCAM at location 34 is the OE region, and abnormal bright regions at locations 7–12 were influenced by abnormal reflections at large phase angles. (c) Site 7. Locations 50 and 51 represent the OE region, while locations 19–22 are at large phase angles. (d) Site 8. There is no major OE region, with locations 25–28 slightly influenced by abnormal reflections.
Current usage metrics show cumulative count of Article Views (full-text article views including HTML views, PDF and ePub downloads, according to the available data) and Abstracts Views on Vision4Press platform.
Data correspond to usage on the plateform after 2015. The current usage metrics is available 48-96 hours after online publication and is updated daily on week days.
Initial download of the metrics may take a while.