Open Access
Fig. 2
Download original image
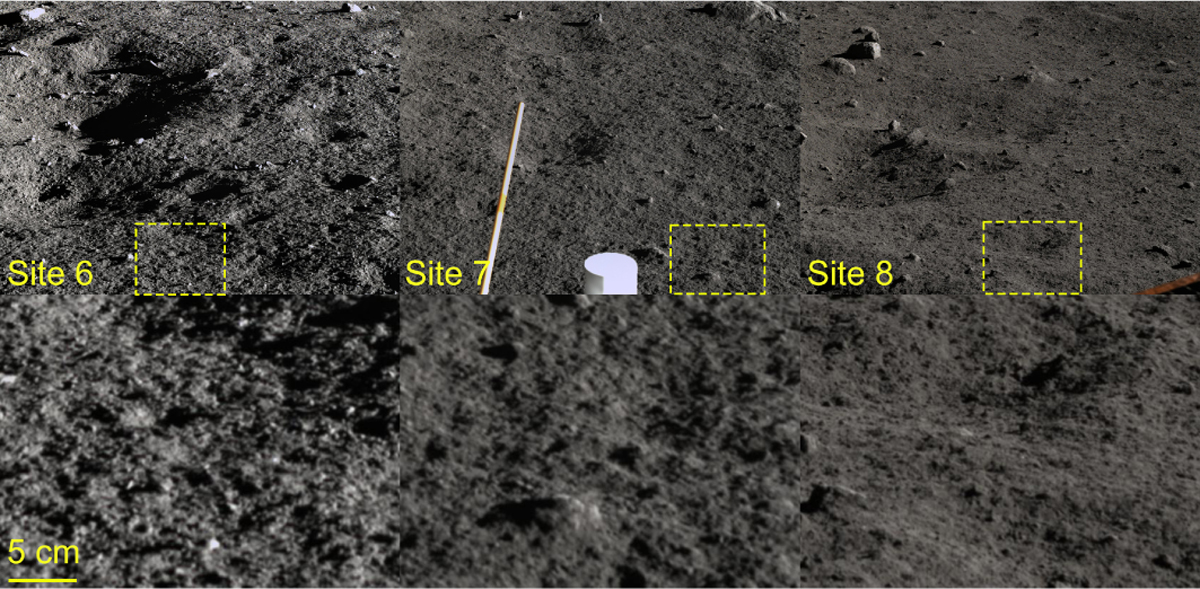
Example images of the inner rings. The top row is the entire image, and the bottom row is the zoom of each yellow dotted box. The plotting scale represents an approximate scale at the bottom of the images. The labels of the images are 041_0006 (Site 6), 056_0007 (Site 7), and 052_0008 (Site 8).
Current usage metrics show cumulative count of Article Views (full-text article views including HTML views, PDF and ePub downloads, according to the available data) and Abstracts Views on Vision4Press platform.
Data correspond to usage on the plateform after 2015. The current usage metrics is available 48-96 hours after online publication and is updated daily on week days.
Initial download of the metrics may take a while.